Thursday, July 9, 2015

With Little Building Going On, Homeowners With Equity Can Sell Fast and High

NEW YORK (TheStreet) -- Thirty-year fixed mortgage rates are down a bit this week, to just under 4.70%, according to the BankingMyWay Weekly Mortgage Rate Tracker, but the long-term mortgage trend is on the upside, and it could be just a matter of time before average 30-year rates rise to 5%.

Indeed, some mortgage brokers tell BankingMyWay they're already seeing regular rates north of the 5% mark, which should raise eyebrows for both homebuyers and sellers. [Read: Why the Housing Recovery Doesn't Matter for Millions of Us ]

The National Association of Realtors says higher rate are the primary reason home sales have slowed lately. Its monthly Pending Home Sales Index says the 1.3% decline in U.S. residential home deals in July were "because of higher mortgage rates slowing the market."

That's particularly true in the U.S. Northeast and West, where home prices are growing, the NAR reports. "The modest decline in sales is not yet concerning, and contract activity remains elevated, with the South and Midwest showing no measurable slowdown," says Lawrence Yun, chief economist at the NAR. "However, higher mortgage interest rates and rising home prices are impacting monthly contract activity in the high-cost regions of the Northeast and the West." "More homes clearly need to be built in the West to relieve price pressure, or the region could soon face pronounced affordability problems," he says. Other real estate professionals agree, noting that whether you're a buyer or a seller, now may be time to get into the market. [Read: Report: 8.3M Homeowners Will Be Overwater, Able to Sell in 15 Months ] "Homebuyers shouldn't let this year's increase in interest rates drive them out of the market," says Rick Allen, chief financial officer at MortgageMarvel.com, a mortgage shopping marketplace. "Rates on a 30-year fixed mortgage are around 4.5% with zero points down right now. This is close to where they were roughly two years ago, and at that time, people were thrilled with the rates. No one knows the direction of rates for sure, but today's rates remain very favorable for mortgage refinancing."

Allen also sees the inventory issue much like Yun does -- as good news for home sellers, who don't have a lot of competition as the summer selling season draws to a close.

"Those looking to sell shouldn't hesitate to list their homes if they have equity," he says. "There's still a shortage of properties for sale in any markets, and new home building remains modest. Sellers should be able to get a favorable offer relatively quickly in most markets."

Allen notes the inventory for U.S. home sales remains fairly flat, and that the new supply of homes for sale stands at roughly 2.22 million, a low number for a healthy residential real estate market. He adds that while home building is coming back, the supply of housing for sale is not likely to grow much unless building grows by another 50% over current levels.

In this environment, it's tough to tell homebuyers to sit tight and wait for mortgage rates to drop. The likelihood is they won't. [Read: Can You Handle Selling a Home By Yourself?] But with good homes at a premium right now, buying a dream property means doing tons of research, talking to plenty of lenders and making sure your credit rating is pristine -- and stays that way for the next few months. If you can manage that, chances are you can still get a decent home at a decent price and at a decent mortgage rate. These days, that's about all you can ask for.

Thursday, June 18, 2015

The Heavy Price of Stockpicking

The tab for speculating in the stock market is about 4% a year, according to the calculation of one influential wealth manager. That’s a harsh penalty to pay when the S&P 500’s average annual result over the past 15 years is barely above that amount, at 4.28%.

Eric NelsonEric Nelson of Servo Wealth Management goes through the grim numbers in his July newsletter to clients.

The Oklahoma City-based registered investment advisor and Dimensional Fund Advisors loyalist starts his analysis at the professional money manager level, arguing that their performance as measured against indexes shows they lack market-beating skill.

Unlike top athletes or surgeons who demonstrate superior abilities, Nelson’s scorecard reveals that just 20% of fund managers beat their index from 2008 to 2012 and that the number who did so in most categories closely matched the number of mutual funds that were outright closed “due to horrendous underperformance.”

For example, 24.6% of active large-cap funds beat their index during that period, while 27.7% of active large-cap funds were shut down. The category that exhibited the least correspondence was not to the credit of professional managers: Just 9.6% of active short-term bond funds beat their index—far less than the 21.7% of such funds that closed during that period.

Nelson attributes manager selection to a Lake Wobegon mentality that assumes their manager is better than average. Yet he argues that people select their better-than-average managers based on past performance that doesn't persist.

Nelson cites data from Standard & Poor's showing the performance of the top managers from 2003 to 2007 in the subsequent five-year period from 2008 to 2012. Just 24.1% of top quartile managers remained in the top quartile, whereas 19.3% fell to the second quartile, 20.3% to the third quartile and 23.1 dropped to the last quartile; the missing 13.3% lost their jobs as their funds were shut down.

The wealth manager concludes: “So even when narrowing the search for a professional active manager to only those who have previously produced the best results, we still find the chance of future index-beating returns is no better than choosing at random (by chance, we’d expect to have 1/4 odds of landing in each of the four quartiles, and a bit less when we consider the odds of disappearing completely).”

Nelson notes there are actually greater odds (nearly 37%) of a top fund falling to the bottom quartile or disappearing than remaining in the top quartile (24%).

The professional advisor emphasizes that this poor performance emanates from people with chartered financial analyst (CFA) designation and Ivy League MBAs.

“If they can’t get it right," he asks, "what is the chance that a do-it-yourself investor running a Charles Schwab or Morningstar stock screener for a few hours in the evening or on the weekends will perform better?”

Drilling down further, Nelson next takes a page out of John Bogle’s book, literally, and considers both the underperformance of active managers and bad investor behavior.

Bogle’s The Clash of the Cultures shows that large-cap funds returned 4.1% to investors from 1997 to 2011, compared with 5.4% for their S&P 500 benchmark. While the numbers are both small, Nelson points out that that means 37% less wealth over 15 years for active fund investors, and 72% less wealth over the same time period compared to the wealth managers’ clients invested in his favorite DFA US Large Value Fund (DFLVX).

“But even this dismal result is too generous,” Nelson says, since naughty investors typically dump poor-performing funds for those with recent good performance, which subsequently perform poorly, which “amplifies the return deficit.”

Citing Bogle again, Nelson shows that investor returns trail fund returns by nearly 2% on average.

“So between poor professional management and bad investor behavior, the total cost speculators pay is almost 4% per year!” Nelson says in summary, calling on investors to save their wealth through the discipline of a fee-only investment advisor.

---

Check out Your Move, Bogleheads: Advisor Finds DFA’s Returns Trump Vanguard’s.

Wednesday, June 17, 2015

ETF Pop Quiz: Hong Kong, Healthcare, and Home Depot

After another week in the global market, the ETFdb pop quiz returns with another round of questions about Hong Kong, Healthcare, and Home Depot.

As always, all answers can be found using the suite of free tools at ETFdb.com, including the ETFdb Categories, ETF screener and the ETF Analyzer.


1. Which Hong Kong ETF has the lowest expense ratio?

2. Which Real Estate ETF has the highest average daily trading volume?

3. Which Healthcare ETF has the most assets under management, Vanguard's Health Care Index FUnd (VHT) or iShares' Dow Jones US Healthcare Sector Index Fund (IYH)?

4. Which PIMCO ETF has the highest year-to-date return?

5. Which ETF has the highest exposure to Home Depot (HD)?

Also test your knowledge with our past Pop Quizzes

Gold, GBP, and Gaming

Food, Futures Based, and France

Energy, Engineering, and Emerging Market Bonds

Disclosure: No positions at time of writing.

Monday, June 15, 2015

How Bitcoin Works

Bitcoin is a digital currency that exists almost wholly in the virtual realm, unlike physical currencies like dollars and euros. A growing number of proponents support its use as an alternative currency that can pay for goods and services much like conventional currencies. Bitcoin is the first and easily the most popular cryptocurrency, or currency that uses cryptography1 (see "Definitions and Key Concepts" at end of article) to control its creation, administration and security.

Bitcoin was set up in 2009 by a mysterious individual or group with the pseudonym Satoshi Nakamoto, whose true identity is yet to be revealed and who left the project in 2010. It rocketed to prominence in 2013, when the value of a Bitcoin soared more than 10-fold in a two-month period, from $22 in February to a record $266 in April. At its peak, based on more than 10 million bitcoins issued, the cryptocurrency boasted a market value of over $2 billion.

Bitcoin Versus Conventional Currencies
Bitcoin differs from conventional currencies in some very fundamental ways, as noted below (for the sake of simplicity, we use the U.S. dollar as a proxy for conventional currencies). Bitcoin uses P2P technology without a central authority: Bitcoin is a decentralized currency managed by peer-to-peer technology (P2P2), without a central authority. All functions such as Bitcoin issuance, transaction processing and verification are carried out collectively by the network, without a central supervisor or agency to oversee operations. In contrast, a conventional currency is issued by a central bank as part of its mandate to manage national monetary policy. In the U.S., only the Federal Reserve has the power to issue dollars; it is also the central authority that conducts monetary policy, supervises banks, maintains financial system stability, and provides financial services to depository institutions. Bitcoin is primarily digital: Although physical Bitcoins are available from companies such as Casascius and BitBills, Bitcoin has been designed primarily to be a digital currency. Physical Bitcoins are somewhat of a novelty, and the very idea of a tangible form defeats the purpose of a digital currency, according to the most ardent supporters of the concept. Conversely, your dollars exist primarily in physical form; the balances that you hold at your bank and online brokerage can be converted into physical dollars within minutes if you so desire. Bitcoin has a maximum 21 million limit: The total number of Bitcoins that will be issued is capped at 21 million. The Bitcoin "mining"3 process presently creates 25 Bitcoins every 10 minutes (the number created will be halved every four years), so that limit will not be reached until the year 2140. While Bitcoin critics argue that the maximum limit is not large enough, supporters maintain that since each Bitcoin is divisible to eight decimal places, the number of fractional Bitcoins (called "satoshis") – at 21 x 1014 – will be more than enough for all conceivable applications. Conventional currencies, on the other hand, can be issued without limit. Bitcoin is a complex product: The concepts of cryptocurrencies in general are abstruse and abstract, and understanding how and why Bitcoin works requires a fair degree of technological knowledge. Bitcoin has limited acceptance: It has limited acceptance so far and cannot be used at brick-and-mortar storefronts, although that may eventually change if it continues to gain traction. The dollar, on the other hand, has near-universal acceptance as the world's global reserve currency. Bitcoin transactions have limitations: A Bitcoin transaction can take as long as 10 minutes to confirm. Transactions are also irreversible and can only be refunded by the Bitcoin recipient. These limitations do not exist with conventional currencies, where debit and credit transactions are confirmed within seconds; certain transactions can also be reversed for valid reasons by the originator, without having to rely on the recipient's largesse. Bitcoin balances are not insured: This means that if you lose your Bitcoins for any reason – for example, your hard drive crashes, or a hacker steals the digital wallet in which your Bitcoins are stored, or the Bitcoin exchange where you held a balance went out of business – you have little recourse. Currency balances held at banks, on the other hand, are insured against certain events such as bank failure by agencies like the Federal Deposit Insurance Corporation in the U.S. How Bitcoin Works
Let's say you want to test the Bitcoin waters. The first thing you need to do as a new user is install a digital wallet on your computer or mobile device. This wallet is simply a free, open-source software program that will generate your first and subsequent Bitcoin addresses. There are three types of wallets – a software wallet (installed on your computer), a mobile wallet (which resides on your mobile device) or a Web wallet (located on the website of a service provider that hosts bitcoins).

Bitcoin uses public key encryption4 techniques for security. This means that when a new Bitcoin address is created, a cryptographic key pair consisting of a public key and private key – which are essentially unique, long strings of letters and numbers – is generated.

Each address has its own Bitcoins balance, so all you need to do is acquire a number of Bitcoins that will be held at one of the addresses in your wallet. You can acquire Bitcoins through a number of ways – by buying them from a Bitcoin currency exchange such as Mt. Gox or Bitstamp, or through a service like BitInstant that enables fund transfers between Bitcoin exchanges and supports various payment mechanisms.

Note that all Bitcoin transactions are stored publicly and permanently on the Bitcoin network, which means that the balance and transactions of any Bitcoin address are visible to anyone. Experts therefore recommend that Bitcoin owners create a new address for each transaction as a means of ensuring privacy and enhancing security.

Once you have created a Bitcoin address and have acquired Bitcoins, you can use them for an online transaction with a company that accepts Bitcoins as a payment mode. The company will send you the Bitcoin address to which you can send your Bitcoin payment. You direct the payment to that address; while the transaction takes place within seconds, verification can take 10 minutes or longer.

All Bitcoin transactions, without exception, are included in a shared public transaction log known as a "block chain". This is to confirm that the party spending the Bitcoins really owns them, and also to prevent fraud and double-spending.5

Why does transaction verification or confirmation take so long? Because the complex algorithms involved in Bitcoin mining (see description below) take time to solve, even with immense computing power at one's disposal.

An Example of a Bitcoin Transaction
Let's assume you want to make an online payment to a company – call it BitChamp – using 5 Bitcoins that you have in an address in your digital wallet. Here are the steps in the transaction: BitChamp creates a new Bitcoin address and directs you to send your payment to it. This creates a private key (known only to BitChamp) and a public key (available to you and anyone else). Note that just as a seller does not need to know your physical identity if you pay cash, you do not need to disclose your real identity to BitChamp and can remain anonymous. You instruct your Bitcoin client (the free Bitcoin software you first installed on your computer) to transfer 5 Bitcoins from your wallet to the BitChamp address. This is the transaction message. Your Bitcoin client will electronically "sign" the transaction request with the private key of the address from where you are transferring the Bitcoins. Recall that your public key is available to anyone for signature verification. Your transaction is broadcast to the Bitcoin network and will be verified in a few minutes. The 5 Bitcoins have been successfully transferred from your address to the BitChamp address. Note that only the first two steps involve action by the seller and you respectively. The latter two steps are automatically executed by the Bitcoin client software and Bitcoin network. As well, storing the private key attached to an address safely and securely is of the utmost importance; otherwise, anyone who obtains the private key can control the Bitcoins at that address and use them fraudulently.

Bitcoin Pros and Cons
Bitcoin has a number of advantages: As the first cryptocurrency to capture the public imagination, Bitcoin has "first mover" advantage and a head start over the competition. Total issuance is limited to 21 million, so it is unlikely to be devalued because of the prospect of a massive influx of new bitcoins. As a decentralized currency, Bitcoin is free from government interference and manipulation. Transaction costs are much lower than with conventional currencies. On the flip side, Bitcoin's disadvantages include: The price of a Bitcoin has been increasingly volatile, making it difficult to assess its real value and increasing the risk of losses for investors in the cryptocurrency. The relative anonymity of Bitcoin may encourage its use for illegal and illicit activities such as tax evasion, weapons procurement, gambling and circumvention of currency controls. The fact that bitcoins exist primarily in digital form renders them vulnerable to loss. Conclusion
Bitcoin has made significant progress in its adoption and usage since it was unveiled in 2009. Its evolution over the next few years will determine whether this leading cryptocurrency will become an integral part of the global financial system, or whether it is destined to remain a niche player.

Definitions and Key Concepts

1 Cryptography refers to the practice and technique of using encryption for secure communication and transmission of data and information.

2 In a P2P network, a group of computers is connected to enable the sharing of resources and information by users, and there is no central location for the network. This is diametrically opposed to a typical client-server network, where the central server controls the level of access by users to shared network resources. Popular applications of the P2P concept are Skype and file-sharing services such as BitTorrent.

3 Bitcoin mining refers to the computationally-intensive task of generating Bitcoins. While any computer can be put to the task of Bitcoin mining by using a free mining application, in reality a great deal of computing power is required to solve the extremely complex algorithms involved and to share those solutions with the entire Bitcoin network. The mining process is quite complicated and involves advanced concepts such as cryptographic hashes and nonces.

In simple terms, Bitcoin miners use powerful computers to track and compile pending Bitcoin transactions every 10 minutes into a new block. These miners then set to work doing the intensive number-crunching required to verify all the transactions in the block. This is a competitive process, and the first miner to solve the algorithms and verify the transactions transmits the results to the entire Bitcoin network. Upon confirmation by the rest of the network, the block is then added to the block chain. Each block includes a certain number of Bitcoins in a "coinbase" transaction that is paid out to the successful miner. This reward was set at 50 Bitcoins when the system first commenced operations in 2009, but was halved to 25 Bitcoins in November 2012, and will reduce by 50% approximately every four years.

4 Public key encryption combines a public key and a private key. While the public key is available to anyone, the matching private key is stored securely in the digital wallet and is generally password-protected. Each Bitcoin transaction is signed by the private key of the initiating user, providing mathematical proof that it has indeed originated from the owner of the address, and preventing the transaction from being altered once it has been issued. Since the key pair is mathematically related, any data or information encrypted with a private key may only be decrypted or deciphered with the corresponding public key and vice versa.

5 Double-spending means spending the same digital currency twice, something that is impossible with physical currencies.

Tuesday, June 9, 2015

Ford's Attempt to Revive Europe Sales


Ford's Escape/Kuga looks to help revive sales in Europe. Photo Courtesy of Ford.

It's been a great couple months for Ford (NYSE: F  ) and its investors; we've witnessed the stock price almost reach $16 as of Thursday. It's come a long way from its 52-week low of $8.82, much to the delight of Ford investors. One of the major remaining overhangs on the stock is losses in Europe, and when the company manages to improve the situation in the region, we could witness yet another positive catalyst for the stock price. I'll explain management's expectations, and how Ford is attempting to boost sales in Europe.

By the numbers
In the first quarter, General Motors (NYSE: GM  ) announced it had lost $175 million in Europe, which was an improvement from last year's first quarter, but still added to a staggering grand total of about $18 billion. While Ford's total losses aren't nearly as massive as GM's, it still has work to do; its first quarter losses hit about $462 million in Europe and it still expects to lose $2 billion this year. In a region where many countries face 20% unemployment or worse, people simply aren't jumping to buy cars.

Management from GM and Ford both hope to see the region stabilize in 2014, allowing both to break even around mid-decade. Until then, both will be cutting costs and capacity at numerous plants.

According to USA Today, Ford estimates that closing its plant in Belgium at the end of 2014 will cost roughly $750 million in cash expenditures. Ford is also closing two other plants in U.K. and will attempt to lower its overall capacity.

Ford isn't falling into the same trap we saw during the U.S. financial crisis where automakers dished out thousands of dollars in incentives in an attempt to maintain market share. Rather it's boosting its advertising and conceding market share to keep losses from growing substantially.

Advertising campaign
As Ford increases its overall advertising budget for Europe, it plans to keep its TV and print spending flat this year, according to AutoNews Europe. The increase will be felt in its digital platforms, which includes social media – a budget increase from 15% in 2012 to 35% in 2014.

The campaign is attempting to call out one specific technology feature per model, attracting different target markets. The Fiesta, which has done well attracting younger consumers, is going to feature the ability to link a smartphone to Ford's Sync entertainment system.

Ford's Escape has sold extremely well in the U.S. and has a chance to top 300,000 units sold for 2013 – a rare feat for Ford vehicles other than the F-Series. It's been welcomed with very positive reviews in China, and Ford expects it to be the most successful of its Europe advertising during the Champions League finale concluded last weekend.

"We think the audience is very close to the people we want to reach for the Kuga and SUVs in general," Elena Cortesi, Ford of Europe director of earned and social media, told AutoNews Europe, "and we're explaining the car mainly through the automatic tailgate."

Bottom line
It's been a nice ride for Ford's stock price recently, but two years from now if the company can break even in Europe it could send an additional $2 billion straight to bottom-line profits. That would clearly be a huge positive catalyst for the stock price. It's also reassuring to see that management has learned from mistakes made during the U.S. financial crisis and the ensuing recession, and is not resorting to massive incentives to sell vehicles.

I like the strategy to increase advertising and build its brand while conceding some market share to stabilize losses. Overall, things look bright for Ford and its investors, and the market is finally taking notice.

If you're concerned that Ford's turnaround has run its course, relax – there's good reason to think that the Blue Oval still has big growth opportunities ahead. We've outlined those opportunities in detail, in the Fool's premium Ford research service. If you're looking for some freshly updated guidance to Ford's prospects in coming years, you've come to the right place – click here to get started now.

Monday, June 8, 2015

Microsoft's Biggest Product Since Windows 95

While one tech titan was defending its (lack of) tax payments to the United States Senate, another introduced its first truly cutting-edge product in many moons. Tuesday saw the unveiling of Microsoft's (NASDAQ: MSFT  )  Xbox One. Now, this isn't your 12-year-old nephew's gaming console, it's a formidable and first-of-its-kind effort to create an interactive, all-encompassing home entertainment set-top box. While gamers and game-makers will rejoice with news of a new, top-of-the-line console, investors should be tingling with excitement -- because this may be the most compelling thing to come out of Redmond since Windows 95.

Big claim
The above paragraph has some lofty statements, I know. Moreover, I have not seen one of the machines in person nor witnessed firsthand its capability. To top it off, after Tuesday's announcement, Microsoft's stock remained nearly unchanged. Apparently Wall Street was unmoved by the highly anticipated unveiling. Competitor Sony soared nearly ten points, though the move was not related, as some outlets reported.

Still, am I wrong to believe that this new system is something worth cheerleading?

Feature-rich
Let's not dwell on specs that mean nothing to most of us -- one can assume this gaming console has fantastic graphics and will be comparable to the coming Sony Playstation 4. A fancy graphics processor isn't going to send Microsoft back to its glory days of relevancy, anyway.

But the Xbox One does have plenty of headline-worthy features. For one, the console allows for split-screen gaming, television watching, Skype video calling, and more. This is something smart TVs have been trending toward, but haven't quite made the leap. The Xbox One, though not a TV, is the first device we have seen to offer full split-screen functionality. Users can play Call of Duty while talking to Grandma via Skype. While you are watching Iron Man via Netflix streaming on your Xbox One, you can simultaneously Google (I mean, Bing?) how much Robert Downey Jr. is paid for each film, and why that'll never happen to you. The possibilities are endless! But seriously, this feature has important implications for the future of TV-based content consumption.

Ad me!
Cable companies and their advertisers are concerned with the increasing inefficacy of commercia  breaks. For one, we have devices that enable us to skip ads entirely. But even when they are on our TVs, we are more and more likely to mute the TV and pick up our iPads. A three-minute dedicated commercial run just isn't hacking it anymore. With split-screen, multifunctioning abilities, Microsoft can offer advertisers a unique (and likely more effective) way to reach out to viewers, engaging them throughout the viewing process.

Talkies
Another big deal regarding the Xbox One is its enhanced Kinect and voice control properties. In this light, the device sounds like it has achieved much of what everyone has constantly speculated that Apple will/would/should achieve with its eventual Apple TV. Siri-like interaction with the Xbox One will allow users to manage everything from "power on" to "watch ESPN." That's right, the days of the overwhelmingly blue TV guide menu will soon be a thing of the past -- at least for Xbox One owners.

A real product
Though a fan of Microsoft as a stock, I have rarely been impressed with a product offering from the company. It nearly always seems as if the Redmond-based company is putting out afterthought, catch-up products that still aren't as good as a certain Cupertino competitor's.

The Xbox One seems different. It is much, much more than a gaming console, and has implications for the future of television, all while putting Microsoft deep in the game.

Of course, we'll know more as time goes on, and it will be interesting to see what Sony throws out on June 10th for its PS4 unveiling. But for a first impression, well, I'm impressed.

More from The Motley Fool
It's been a frustrating path for Microsoft investors, who've watched the company fail to capitalize on the incredible growth in mobile over the past decade. However, with the release of its own tablet, along with the widely anticipated Windows 8 operating system, the company is looking to make a splash in this booming market. In a new premium report on Microsoft, a Motley Fool analyst explains that while the opportunity is huge, so are the challenges. The report includes regular updates as key events occur, so make sure to claim a copy of this report now by clicking here.

Infinera vs. Ciena: Who Will Win the Multimillion-Dollar Deal With Level 3 Communications?

At risk of losing U.S. partnerships, Level 3 Communications  (NYSE: LVLT  ) may soon strike a multimillion-dollar, three-year optical networking deal with Infinera  (NASDAQ: INFN  ) or Ciena  (NASDAQ: CIEN  ) .

While Level 3 seemed satisfied with Huawei's networking equipment for years, that all changed in the past few months. In March and in April, both President Obama and House Intelligence Committee Chairman Mike Rogers (R-Mich.) have made it harder for Huawei to operate in the U.S. It's only a matter of time until Level 3 -- and it's Huawei equipment -- finds it difficult to do business in the U.S.

Soon, Level 3 will probably go the way of AT&T and Verizon and spurn Huawei's equipment. That leaves open a huge multimillion-dollar, multi-year deal wide open. The two companies likely to fill the void are U.S.-based Infinera or Ciena.

So, who will Level 3 choose? In the video below, Motley Fool contributor Kevin fills you on which company will prevail. The reason might surprise you.

The mobile revolution is still in its infancy, but with so many different companies it can be daunting to know how to profit in the space. Fortunately, The Motley Fool has released a free report on mobile named "The Next Trillion-Dollar Revolution" that tells you how. The report describes why this seismic shift will dwarf any other technology revolution seen before it and also names the company at the forefront of the trend. You can access this report today by clicking here -- it's free.

Thursday, June 4, 2015

How Earnings at United Technologies Will Fare

On Tuesday, United Technologies (NYSE: UTX  ) will release its latest quarterly results. The key to making smart investment decisions on stocks reporting earnings is to anticipate how they'll do before they announce results, leaving you fully prepared to respond quickly to whatever inevitable surprises arise. That way, you'll be less likely to make an uninformed knee-jerk reaction to news that turns out to be exactly the wrong move.

A member of the Dow Jones Industrials (DJINDICES: ^DJI  ) , United Technologies has a wide range of businesses under its roof, ranging from elevator manufacturing to heating and cooling systems for institutional customers. But aerospace has become the company's bread and butter, and it will continue to gain importance into the future. Let's take an early look at what's been happening with United Technologies over the past quarter and what we're likely to see in its quarterly report.

Stats on United Technologies

Analyst EPS Estimate

$1.30

Change From Year-Ago EPS

(0.8%)

Revenue Estimate

$14.94 billion

Change From Year-Ago Revenue

20.2%

Earnings Beats in Past 4 Quarters

4

Source: Yahoo! Finance.

Will United Technologies be able to keep earnings up this quarter?
Analysts have recently upgraded their views on United Technologies and its earnings prospects, with an increase in their consensus for the just-ended quarter by $0.02 per share. They've also bumped up full-year 2013 estimates by triple that amount, helping to send the stock to all-time record highs and gain almost 10% just since mid-January.

United Tech has continued to move forward after having completed its acquisition of aircraft component maker Goodrich last year, focusing more heavily on the aerospace industry. In recent months, United Tech has made several asset sales on non-core divisions, with the latest coming last month when it sold its electrical power systems unit to France's Safran for $400 million.

But on the defense front, United Tech could see pressure from the end of some successful programs. Earlier this month, the company said that it had successfully completed its production of F117 engines for the Air Force's fleet of C-17 aircraft and expects to shift to a much slower pace to provide spare replacement engines as needed. With tough conditions in the Defense Department, it'll be harder than ever for United Tech to replace maturing contracts with new business.

Still, the commercial aircraft space holds huge promise for United Tech. The company's Pratt & Whitney engine manufacturer has a long-standing relationship with Boeing (NYSE: BA  ) , which itself has projected trillions of dollars of orders for commercial aircraft over the next 20 years. But United Tech has also branched out beyond Boeing, with the announcement last month that it will supply a range of components, including engines, electrical systems, and brake systems, for Embraer (NYSE: ERJ  ) . Given the E-Jets manufacturer's strong growth in the face of Latin American expansion, Embraer has great promise, and United Tech is smart to latch onto it.

In United Tech's earnings report, watch for ongoing signs of how well the integration of the Goodrich acquisition is going. After such a massive buyout, it can take a long time for the corporate culture to gel back into place, but United Tech has such strong prospects that it should be able to get everyone behind its profit opportunities.

United Tech relies on Boeing for a big part of its business. But will Boeing live up to its full potential? In our premium research report on the company, two of The Motley Fool's best minds on industrials have collaborated to provide investors with the key, must-know issues surrounding Boeing. They'll be updating the report as key news hits, so don't miss out -- simply click here now to claim your copy today.

Click here to add United Technologies to My Watchlist, which can find all of our Foolish analysis on it and all your other stocks.

Tuesday, June 2, 2015

3 Biotech Stocks Under $10 in Breakout Territory

DELAFIELD, Wis. (Stockpickr) -- At Stockpickr, we track daily portfolios of stocks that are the biggest percentage gainers and the biggest percentage losers.

Must Read: 5 Hated Earnings Stocks You Should Love

Stocks that are making large moves like these are favorites among short-term traders because they can jump into these names and try to capture some of that massive volatility. Stocks that are making big-percentage moves either up or down are usually in play because their sector is becoming attractive or they have a major fundamental catalyst such as a recent earnings release. Sometimes stocks making big moves have been hit with an analyst upgrade or an analyst downgrade.

Regardless of the reason behind it, when a stock makes a large-percentage move, it is often just the start of a new major trend -- a trend that can lead to huge profits. If you time your trade correctly, combining technical indicators with fundamental trends, discipline and sound money management, you will be well on your way to investment success.

With that in mind, let's take a closer look at a several stocks under $10 that are making large moves to the upside.

Must Read: 5 Rocket Stocks Ready to Bounce Higher

Novavax

Novavax (NVAX), a clinical-stage biopharmaceutical company, focuses on discovering, developing and commercializing recombinant protein nanoparticle vaccines and adjuvants. This stock closed up 3.1% to $4.33 in Tuesday's trading session.

Tuesday's Range: $4.18-$4.59

52-Week Range: $2.68-$6.95

Tuesday's Volume: 6.68 million

Three-Month Average Volume: 2.94 million

From a technical perspective, NVAX spiked sharply higher here right above some near-term support at $4 with heavy upside volume flows. This spike briefly pushed shares of NVAX into breakout territory above $4.35 and back above its 50-day moving average of $4.49. Shares of NVAX tagged an intraday high of $4.59, before closing just below that level at $4.33. Market players should now look for a continuation move to the upside in the short-term if NVAX manages to take out Tuesday's intraday high of $4.59 with high volume.

Traders should now look for long-biased trades in NVAX as long as it's trending above some key near-term support at around $4 and then once it sustains a move or close above $4.59 with volume that hits near or above 2.94 million shares. If that move develops soon, then NVAX will set up to re-test or possibly take out its next major overhead resistance levels at its 200-day moving average of $4.82 to $5, or even $5.20 to $5.50.

Must Read: 4 Stocks Spiking on Unusual Volume

OxiGene

OxiGene (OXGN), a clinical-stage biopharmaceutical company, develops therapeutics primarily to treat cancer. This stock closed up 6.8% to $2.33 in Tuesday's trading session.

Tuesday's Range: $2.22-$2.38

52-Week Range: $1.96-$5.40

Tuesday's Volume: 1.75 million

Three-Month Average Volume: 350,305

From a technical perspective, OXGN ripped sharply higher here back above its 50-day moving average of $2.25 with heavy upside volume flows. This stock recently formed a double bottom chart pattern at $2.08 to $2.06. Since forming that bottom, shares of OXGN have started to spike sharply higher and it's quickly approaching a near-term breakout trade. That trade will hit if OXGN manages to take out Tuesday's intraday high of $2.38 to more near-term overhead resistance at $2.45 with high volume.

Traders should now look for long-biased trades in OXGN as long as it's trending above some near-term support at $2.10 or above those double bottom support levels and then once it sustains a move or close above those breakout levels with volume that hits near or above 350,305 shares. If that breakout hits soon, then OXGN will set up to re-test or possibly take out its next major overhead resistance levels at $2.57 to its 200-day moving average of $2.65. Any high-volume move above those levels will then give OXGN a chance to tag $2.80 to $3, or even $3.20.

Must Read: 5 Stocks Ready for Breakouts

Sinovac Biotech

Sinovac Biotech (SVA), a biopharmaceutical company, is engaged in the research, development, manufacture and commercialization of vaccines for hepatitis A, hepatitis B and influenza viruses in the People's Republic of China. This stock closed up 2.5% to $4.89 in Tuesday's trading session.

Tuesday's Range: $4.67-$5.01

52-Week Range: $4.51-$8.14

Tuesday's Volume: 230,000

Three-Month Average Volume: 197,755

From a technical perspective, SVA bounced notably higher here right above its new 52-week low of $4.51 with above-average volume. This spike to the upside on Tuesday is quickly pushing shares of SVA within range of triggering a near-term breakout trade. That trade will hit if SVA manages to take out some near-term overhead resistance levels at $5.14 to its 50-day moving average of $5.22 with high volume.

Traders should now look for long-biased trades in SVA as long as it's trending above its new 52-week low of $4.51 and then once it sustains a move or close above those breakout levels with volume that hits near or above 197,755 shares. If that breakout hits soon, then SVA will set up to re-test or possibly take out its next major overhead resistance levels at $5.69 to $5.80, o even its 200-day moving average at $5.99 to $6.03.

Must Read: Warren Buffett's Top 10 Dividend Stocks

To see more stocks that are making notable moves higher, check out the Stocks Under $10 Moving Higher portfolio on Stockpickr.

-- Written by Roberto Pedone in Delafield, Wis.


RELATED LINKS:


>>3 Big Stocks Breaking Out on Big Volume


>>5 Dividend Stocks About to Hike Payments to Shareholders


>>5 Foreign Stocks to Buy for Gains at Home

Follow Stockpickr on Twitter and become a fan on Facebook.

At the time of publication, author had no positions in stocks mentioned.

Roberto Pedone, based out of Delafield, Wis., is an independent trader who focuses on technical analysis for small- and large-cap stocks, options, futures, commodities and currencies. Roberto studied international business at the Milwaukee School of Engineering, and he spent a year overseas studying business in Lubeck, Germany. His work has appeared on financial outlets including

CNBC.com and Forbes.com.

You can follow Pedone on Twitter at www.twitter.com/zerosum24 or @zerosum24.


Monday, June 1, 2015

The Week's Winners and Losers: GoPro Pops, Aereo Drops

APTOPIX Wall Street GoPro IPO Seth Wenig/APCEO Nick Woodman holds a GoPro camera in his mouth as he celebrates his GoPro's IPO. There were plenty of winners and losers this week, as the leading premium coffeehouse chain expanded its carbonated beverage offerings, and a disruptive video-streaming service got disrupted itself. Here's a rundown of the week's best and worst. GoPro (GPRO) -- Winner The initial public offering market got some fresh meat on Thursday when GoPro went public. The company behind the popular namesake cameras that extreme sports enthusiast like to wear was a hit. It priced at $24 a share -- at the high end of its initial range -- and that still wasn't enough. The stock opened at $28.65, closing out its first day of trading with a 31 percent gain. GoPro's growth has been stellar. Sales soared 87 percent last year to nearly hit $1 billion. However, there was a surprising decline in revenue during this year's first quarter. New GoPro investors are assuming that the most recent quarter's dip was a fluke. If it isn't a fluke, they can record their stumble in glorious high-def. Aereo -- Loser Sometimes it's the disruptor that gets disrupted. Aereo, the start-up service that offers local TV channels as a streaming platform, was pummeled by the U.S. Supreme Court. In a 6-3 decision, the court ruled that Aereo violated the copyrights of major TV networks by streaming their content without paying transmission fees. The move isn't the end for Aereo, but its prognosis has clearly deteriorated. Aereo thought that incorporating tiny remote antennas that subscribers can access online was similar enough to actual HD antenna ownership by individuals that its business model would be found to be legal. That didn't pan out, and consumers are unlikely to get a break this way from their ever-increasing cable and satellite TV bills. Starbucks (SBUX) -- Winner If you need to cool down in the Sun Belt, Starbucks has a few fizzy options. The java giant this week introduced its Fizzio line of carbonated beverages at 3,000 of its stores in the South. Fizzio is a line of handcrafted sodas that launched with three flavors (root beer, ginger ale and lemon ale), at 100 calories or less for 16 ounces. (Half as many calories as a Pepsi, and with cane sugar as the sweetener.) Starbucks is also letting customers pay 50 cents to have their iced teas and Refreshers beverages carbonated with the Fizzio machine. It's a smart call, giving non-coffee drinkers a new reason to walk into Starbucks. Steelcase (SCS) -- Loser Office furniture sales can be a good proxy by which to gauge the state of corporate America, but investors better hope that Steelcase is the exception.

Sunday, May 31, 2015

Ralph Lauren Corp. (RL) Q4 Earnings Preview: Clearance Sales To Hurt Margins?

Ralph Lauren Corp (NYSE:RL) will release its Fourth Quarter and Full Year Fiscal 2014 results for the period ended March 29, 2014 at approximately 8:00 A.M. Eastern, Friday, May 9, 2014. At 9:00 A.M. Eastern, on the same day, the Company will host a conference call for analysts, investors and other interested parties.

Wall Street anticipates that the clothing company will earn $1.63 per share for the quarter, which is $0.22 more than last year's profit of $1.41 per share. iStock expects Ralph Lauren to beat Wall Street's consensus number. The iEstimate is $1.68, a nickel more than expected.

[Related -Ralph Lauren Corp (RL): A Deeper Look Into Ralph Lauren's Stock]

Sales, like earnings, are expected to increase, rising by 11.3% year-over-year (YoY). RL's consensus revenue estimate for Q4 is $1.83 billion, more than last year's $1.64 billion.

Ralph Lauren Corporation is engaged in the design, marketing and distribution of products, including men's, women's and children's apparel, accessories (including footwear), fragrances and home furnishings. The Company operates in three segments: Wholesale, Retail and Licensing.

Beating estimates is nothing new for the fashion company. Ralph Lauren's profits have exceeded Wall Street's consensus number 14 of the last 16 quarters. EPS were on-target for the two outstanding quarterly checkups. On average, RL actual profits bypass projected EPS by $0.23 with a range of $0.11 to $0.50 more than forecasted. That's makes the iEstimate look small by comparison.

[Related -Stocks Close Lower Amid China Data; HP Jumps]

For the most part, RL's earnings-driven, price sensitivity has tracked the bullish nature of earnings announcements. The stock price moved higher 10 of the last 16 quarters, gaining anywhere from 2.2% to 13% with an average increase of 7.28%. Meanwhile, RL's price backed up a half-dozen times by an average of 3.93%.

Unfortunately for shareholders, May has been the worst performing quarter. Shares lost ground three of the last four emerald month announcements, dropping -2.9%, -4.4%, and -4.9% in the days surrounding the news. Once, May 2012, RL managed a 3.8% gain.

For most retailers, margins are the key to bullish or bearish surprises. As it is with RL, we do have some concerns in this regard for Friday morning. In Q3, the cost of goods sold increased 8.34% versus sales gains of 3.08%.  It might now sound like too big of a deal, but it's a $40 million difference had costs increased at the same pace as sales. It works out to $0.45 per share.

RL's balance sheet has some margin eyesores, too. Inventory was up 35.6% during the third quarter, which could mean clearance sales in Q4 i.e. smaller profit margins. Additionally, some customers might be slow to pay their bills as account receivables climbed 25.98%.

Overall: Ralph Lauren Corp (NYSE:RL) history and iEstimate suggest another bullish surprise is coming. However, RL's financial statements raise some concerns. The may not show up this quarter, but they will eventually if not corrected. 

Thursday, May 28, 2015

3 Stocks Spiking on Unusual Volume

DELAFIELD, Wis. (Stockpickr) -- Professional traders running mutual funds and hedge funds don't just look at a stock's price moves; they also track big changes in volume activity. Often when above-average volume moves into an equity, it precedes a large spike in volatility.

>>5 Rocket Stocks for a Tumbling Market

Major moves in volume can signal unusual activity, such as insider buying or selling -- or buying or selling by "superinvestors."

Unusual volume can also be a major signal that hedge funds and momentum traders are piling into a stock ahead of a catalyst. These types of traders like to get in well before a large spike, so it's always a smart move to monitor unusual volume. That said, remember to combine trend and price action with unusual volume. Put them all together to help you decipher the next big trend for any stock.

>>5 Stocks Insiders Love Right Now

With that in mind, let's take a look at several stocks rising on unusual volume recently.

Post

Post (POST) manufactures, markets and distributes ready-to-eat cereals, snacks and active nutrition products in the U.S. and Canada. This stock closed up 5.6% to $54.73 in Wednesday's trading session.

Wednesday's Volume: 1.72 million

Three-Month Average Volume: 576,016

Volume % Change: 202%

From a technical perspective, POST ripped higher here right above its recent low of $50.45 with strong upside volume. This move briefly pushed shares of POST back above its 50-day moving average of $55.52, before the stock closed just below that level at $54.73. Shares of POST are now quickly moving within range of triggering a near-term breakout trade. That trade will hit if POST manages to take out some near-term overhead resistance levels at $55.71 to Wednesday's high of $55.76 with high volume.

Traders should now look for long-biased trades in POST as long as it's trending above Wednesday's low of $51.83 and then once it sustains a move or close above those breakout levels with volume that hits near or above 576,016 shares. If that breakout materializes soon, then POST will set up to re-test or possibly take out its next major overhead resistance levels at $59.97 to its 52-week high at $60.63.

SodaStream International

SodaStream International (SODA) engages in the development, manufacture and sale of home beverage carbonation systems that enable consumers to transform ordinary tap water instantly into carbonated soft drinks and sparkling water. This stock closed up 8.1% at $40.75 in Wednesday's trading session.

Wednesday's Volume: 3.98 million

Three-Month Average Volume: 1.55 million

Volume % Change: 143%

From a technical perspective, SODA gapped up sharply higher here and closed right on its 50-day moving average of $40.75 with strong upside volume. This gap is coming after shares of SODA recently pulled back from $45.20 to its recent low of $37.16. That low occurred right near some previous support at $37. Market players should now look for a continuation move higher in the short-term if SODA manages to take out Wednesday's high of $42.25 to more resistance at $42.50 with strong volume.

Traders should now look for long-biased trades in SODA as long as it's trending above Wednesday's low of $40.20 or above $39 and then once it sustains a move or close above $42.25 to $42.50 with volume that this near or above 1.55 million shares. If that move materializes soon, then SODA will set up to re-test or possibly take out its next major overhead resistance level at $45.20. Any high-volume move above $45.20 will then give SODA a chance to re-fill some of its previous gap-down-day zone from January that started just above $50.

Voxeljet AG

Voxeljet AG (VJET) provides three-dimensional printers and on-demand parts services to industrial and commercial customers. This stock closed up 9.2% at $16.17 in Wednesday's trading session.

Wednesday's Volume: 1.36 million

Three-Month Average Volume: 541,534

Volume % Change: 165%

From a technical perspective, VJET skyrocketed sharply higher here right above some near-term support at $14.06 with strong upside volume. This stock has been downtrending badly over the last month and change, with shares moving lower from its high of $37.49 to its recent low of $14.06. During that slide, shares of VJET have been consistently making lower highs and lower lows, which is bearish technical price action. That move pushed shares of VJET into oversold territory, since its current relative strength index reading is 23.60. Shares of VJET are now starting to rip higher off oversold levels and it has started to trade inside of its gap-down-day zone from earlier this month that started above $20.

Traders should now look for long-biased trades in VJET as long as it's trending above Wednesday's low of $14.90 and then once it sustains a move or close above Wednesday's high of $16.65 with volume that hits near or above 541,534 shares. If we get that move soon, then VJET will set up to re-fill some more of that gap-down-day zone that started just above $20.

To see more stocks rising on unusual volume, check out the Stocks Rising on Unusual Volume portfolio on Stockpickr.

-- Written by Roberto Pedone in Delafield, Wis.


RELATED LINKS:


>>2 Oversold Stocks Ready to Bounce Higher


>>5 Stocks Set to Soar on Bullish Earnings


>>5 REIT Trades Worth Buying in April

Follow Stockpickr on Twitter and become a fan on Facebook.

At the time of publication, author had no positions in stocks mentioned.

Roberto Pedone, based out of Delafield, Wis., is an independent trader who focuses on technical analysis for small- and large-cap stocks, options, futures, commodities and currencies. Roberto studied international business at the Milwaukee School of Engineering, and he spent a year overseas studying business in Lubeck, Germany. His work has appeared on financial outlets including

CNBC.com and Forbes.com. You can follow Pedone on Twitter at www.twitter.com/zerosum24 or @zerosum24.


Stocks Going Ex-Dividend on Friday, April 11 (ABBV, ABT, More)

Ex-dividend dates are very important to dividend investors, since you must purchase a stock prior to its ex-dividend date in order to receive its upcoming dividend payout. For more information, check out Everything Investors Need to Know About Ex-Dividend Dates.

Below we highlight seven big-name stocks going ex-dividend on Friday, April 11.

1. AbbVie Inc.

AbbVie Inc. (ABBV) offers a dividend yield of 3.32% based on Wednesday's closing price of $50.63 and the company's quarterly dividend payout of 42 cents. The stock is down 2.6% year-to-date. Dividend.com currently rates ABBV as “Recommended” with a DARS™ rating of 3.5 stars out of 5 stars.

2. Abbott Labs

Abbott Labs (ABT) offers a dividend yield of 2.34% based on Wednesday's closing price of $37.63 and the company's quarterly dividend payout of 22 cents. The stock is down 1.57% year-to-date. Dividend.com currently rates ABT as “Neutral” with a DARS™ rating of 3.4 stars out of 5 stars.

3. Trinity Industries

Trinity Industries (

Wednesday, May 27, 2015

Stocks mostly higher after Japan jump

Stocks tilted mostly higher on Tuesday as Japan's central bank announced new measures to support growth and Wall Street wondered if the stock market can build on its best weekly gain of the year and climb to a new record.

The Nikkei 225 in Tokyo leaped 3.1% to 14,843.24 after the Bank of Japan said it was doubling the size of its fund to support bank lending and its fund to support economic growth.

U.S. investors were also digesting the release of another disappointing economic report during a period of stormy winter weather. A gauge of manufacturing in the New York region, the so-called Empire State manufacturing index, came in lower than expected at 4.48 in February, down from 12.51 in January and below the estimate of 8.5.

COKE: U.S. soda sales down

In afternoon trading the Dow Jones industrial average was fractionally negative while the Standard & Poor's 500 index and the Nasdaq composite were up 0.2% and 0.7%, respectively.

The Dow could be weighed down by Coca-Cola on Tuesday. The beverage maker reported earnings in line with Wall Street expectations but reported revenues below estimates due to a 1% sales drop in North America caused by a drop in soda sales. In pre-market trading Coke shares were down 1.9% to $38.21.

U.S. markets were closed Monday for the Presidents' Day national holiday. On Friday, U.S. stocks closed higher as the market's recent rally helped cap off the biggest weekly gain of 2014.

Heading into today's trading session, the benchmark S&P 500, which had declined 5.76% through Feb. 3, was within a half of a percentage point of topping its Jan. 15 record high of 1848.38. If the large-company stock index can close at a new high, it would mark an official end to the "pullback" and, perhaps, quell talk of a pending correction, or a drop of 10% or more.

"The S&P 500 had another strong day on Friday, and looks poised to test the recent all-time highs around 1,850," said Schaeffer's Investment Research's senior trading analyst ! Bryan Sapp. The S&P 500 closed Friday at 1838.63, roughly 10 points below its record peak.

In deal news, Dublin-headquartered Actavis said Tuesday it will acquire rival New York-based drug maker Forest Laboratories in a deal valued at approximately $25 billion. News of the deal sent Forest's pre-market shares surging over 30%. Actavis's NYSE-listed pre-market shares leaped 15% before its gains were trimmed to 8%.

FRIDAY: Stocks close with best weekly gains of the year

Benchmark U.S. oil for March delivery was up 35 cents to $100.65 a barrel in electronic trading on the New York Mercantile Exchange. The contract last settled on Friday.

Contributing: Associated Press

Monday, May 25, 2015

2 Stocks Rising on Unusual Volume

 DELAFIELD, Wis. (Stockpickr) -- Professional traders running mutual funds and hedge funds don't just look at a stock's price moves; they also track big changes in volume activity. Often when above-average volume moves into an equity, it precedes a large spike in volatility.

>>4 Big Stocks on Traders' Radars

Major moves in volume can signal unusual activity, such as insider buying or selling -- or buying or selling by "superinvestors."

Unusual volume can also be a major signal that hedge funds and momentum traders are piling into a stock ahead of a catalyst. These types of traders like to get in well before a large spike, so it's always a smart move to monitor unusual volume. That said, remember to combine trend and price action with unusual volume. Put them all together to help you decipher the next big trend for any stock. >>5 Low-Priced Stocks to Trade for Gains With that in mind, let's take a look at several stocks rising on unusual volume recently.

Stock quotes in this article: ICLR, UFS, 
 

Icon

Icon (ICLR) a contract research organization, provides outsourced development services to the pharmaceutical, biotechnology and medical device industries primarily in Ireland, the U.S. and rest of Europe. This stock closed up 3.5% to $43.61 in Wednesday's trading session.

Wednesday's Volume: 562,000
Three-Month Average Volume: 372,292
Volume % Change: 80%

>>5 Ways to Invest Like a Pension Fund From a technical perspective, ICLR jumped higher here right above some near-term support at $41 with above-average. This stock has been uptrending strong for the last two months, with shares moving higher from its low of $36.42 to its intraday high of $43.70. During that uptrend, shares of ICLR have been consistently making higher lows and higher highs, which is bullish technical price action. That move has now pushed shares of ICLR within range of triggering a big breakout trade. That trade will hit if ICLR manages to take out Wednesday's high of $43.70 to its 52-week high at $44.23 with high volume. Traders should now look for long-biased trades in ICLR as long as it's trending above $41 or above its 50-day at $40 and then once it sustains a move or close above those breakout levels with volume that hits near or above 372,292 shares. If that breakout hits soon, then ICLR will set up to enter new 52-week-high territory, which is bullish technical price action. Some possible upside targets off that breakout are $50 to $55.

Stock quotes in this article: ICLR, UFS, 
 

Domtar

Domtar (UFS) designs, manufactures, markets and distributes communications papers, specialty and packaging papers, and adult incontinence products worldwide. This stock closed up 1.1% at $106 in Wednesday's trading session.

Wednesday's Volume: 1.89 million
Three-Month Average Volume: 367,447
Volume % Change: 416%

>>5 Stocks Set to Soar on Bullish Earnings From a technical perspective, UFS trended modestly higher here right above some near-term support at $100 with heavy upside volume. This move is quickly pushing shares of UFS within range of triggering a near-term breakout trade. That trade will hit if UFS manages to take out some near-term overhead resistance at $108 to its 52-week high at $110.20 with high volume. Traders should now look for long-biased trades in UFS as long as it's trending above some near-term support at $100 and then once it sustains a move or close above those breakout levels with volume that this near or above 367,447 shares. If that breakout hits soon, then UFS will set up to enter new 52-week-high territory, which is bullish technical price action. Some possible upside targets off that breakout are $120 to $130. To see more stocks rising on unusual volume, check out the Stocks Rising on Unusual Volume portfolio on Stockpickr. -- Written by Roberto Pedone in Delafield, Wis. RELATED LINKS:   >>3 Huge Stocks to Trade (or Not) >>3 Tech Stocks Under $10 to Watch >>5 Hated Earnings Stocks You Should Love Follow Stockpickr on Twitter and become a fan on Facebook.

Stock quotes in this article: ICLR, UFS, 
  At the time of publication, author had no positions in stocks mentioned. Roberto Pedone, based out of Delafield, Wis., is an independent trader who focuses on technical analysis for small- and large-cap stocks, options, futures, commodities and currencies. Roberto studied international business at the Milwaukee School of Engineering, and he spent a year overseas studying business in Lubeck, Germany. His work has appeared on financial outlets including CNBC.com and Forbes.com. You can follow Pedone on Twitter at www.twitter.com/zerosum24 or @zerosum24.

Sunday, May 24, 2015

Can Apple Continue to Outperform?

With shares of Apple (NASDAQ:AAPL) trading around $560, is AAPL an OUTPERFORM, WAIT AND SEE or STAY AWAY? Let's analyze the stock with the relevant sections of our CHEAT SHEET investing framework:

T = Trends for a Stock’s Movement

Apple designs, manufactures, and markets mobile communication and media devices, personal computers, portable digital music players, and a variety of related software, services, peripherals, networking solutions, third-party digital content, and applications. The company's products and services include the iPhone, iPad, Mac, iPod, Apple TV, a portfolio of consumer and professional software applications, the iOS and OS X operating systems, iCloud, and further accessory, service, and support offerings. Apple also delivers digital content and applications through its iTunes, App, iBook, and Mac App stores.

Since a federal appeals court weighed in on Apple's smartphone war with Samsung (SSNLF.PK) last month, the iPhone-maker's quest to implement a sales ban against its rival's devices has gained a new lease on life. Smartphones have created a nearly $300 billion industry, and the battle to control market share is no longer limited to winning over customers. Equally important is protecting the ideas behind the innovations that propel the multi-billion industry forward.

T = Technicals on the Stock Chart Are Strong

Apple stock has struggled to make significant progress in the last several quarters. The stock is currently pulling back and may need time to consolidate before heading higher. Analyzing the price trend and its strength can be done using key simple moving averages. What are the key moving averages? The 50-day (pink), 100-day (blue), and 200-day (yellow) simple moving averages. As seen in the daily price chart below, Apple is trading above its rising key averages, which signal neutral to bullish price action in the near-term.

AAPL

(Source: Thinkorswim)

Taking a look at the implied volatility (red) and implied volatility skew levels of Apple options may help determine if investors are bullish, neutral, or bearish.

Implied Volatility (IV)

30-Day IV Percentile

90-Day IV Percentile

Apple options

27.87%

86%

83%

What does this mean? This means that investors or traders are buying a very significant amount of call and put options contracts, as compared to the last 30 and 90 trading days.

Put IV Skew

Call IV Skew

January Options

Flat

Average

February Options

Flat

Average

As of today, there is an average demand from call buyers or sellers and low demand by put buyers or high demand by put sellers, all neutral to bullish over the next two months. To summarize, investors are buying a very significant amount of call and put option contracts and are leaning neutral to bullish over the next two months.

On the next page, let’s take a look at the earnings and revenue growth rates and the conclusion.

E = Earnings Are Miixed Quarter-Over-Quarter

Rising stock prices are often strongly correlated with rising earnings and revenue growth rates. Also, the last four quarterly earnings announcement reactions help gauge investor sentiment on Apple’s stock. What do the last four quarterly earnings and revenue growth (Y-O-Y) figures for Apple look like and more importantly, how did the markets like these numbers?

2013 Q3

2013 Q2

2013 Q1

2012 Q4

Earnings Growth (Y-O-Y)

-4.73%

-19.85%

-17.97%

-0.43%

Revenue Growth (Y-O-Y)

4.19%

0.86%

11.27%

17.65%

Earnings Reaction

-2.49%

5.13%

-0.16%

-12.35%

Apple has seen decreasing earnings and increasing revenue figures over the last four quarters. From these numbers, the markets have been pleased with Apple’s recent earnings announcements.

P = Average Relative Performance Versus Peers and Sector

How has Apple stock done relative to its peers, Google (NASDAQ:GOOG), Microsoft (NASDAQ:MSFT), BlackBerry (NASDAQ:BBRY), and sector?

Apple

Google

Microsoft

BlackBerry

Sector

Year-to-Date Return

9.25%

57.19%

38.61%

-37.70%

4.38%

Apple has been an average performer, year-to-date.

Conclusion

Apple strives to provide innovative products and services that consumers and companies love to own. Since a federal appeals court weighed in on Apple's smartphone war with Samsung last month, the iPhone-maker's quest to implement a sales ban against its rival's devices has gained a new lease on life. The stock hasn't made significant progress in the last several years, but is currently pulling back. Over the last four quarters, earnings have been decreasing while revenues have been rising, which has left investors pleased. Relative to its peers and sector, Apple has been an average year-to-date performer. Look for Apple to OUTPERFORM.

Tuesday, May 19, 2015

Yahoo poaches NYT tech columnist David Pogue

david pogue yahoo

David Pogue is leaving the New York Times after 13 years.

NEW YORK (CNNMoney) From the Gray Lady to the Big Purple Turnaround: Yahoo has poached famed New York Times tech columnist David Pogue to head up its consumer-tech coverage.

Pogue will lead a "major expansion" of Yahoo's tech coverage on a new website starting later this year, the company said.

Under CEO Marissa Mayer's leadership, Yahoo (YHOO, Fortune 500) has been working to launch big new initiatives while streamlining its focus. Pogue acknowledged Yahoo's underdog status and noted that he has "given them a few swift kicks myself over the years." But the columnist said he is impressed by Mayer, and she is the main reason he was willing to leave the Times (NYT) after 13 years.

"This is a company that's young, revitalized, aggressive -- and, under Marissa Mayer's leadership, razor-focused, for the first time in years," Pogue wrote on Tumblr, the blog site that Yahoo bought in May.

And in poaching Pogue, Mayer has scored another splashy addition for Yahoo.

Pogue's columns about consumer gadgets and services have appeared in the Times every Thursday since 2000. His humorous, approachable and influential reviews are highly sought after by tech companies and widely read by consumers.

Related story: Marissa Mayer at Fortune's Most Powerful Women conference

Pogue will start at Yahoo in a few weeks, he said in his blog post. In addition to publishing columns, blog posts and videos, he also has plans "for all kinds of online and real-world creations."

Pogue, a 25-year industry veteran, is also a bestselling author, a columnist at Scientific American, and a correspondent on both CBS (CBS, Fortune 500) and PBS. He'll keep those side jobs after his jump to Yahoo.

The Times isn't the only newspaper to lose its star tech columnist recently. Last month, news broke that Walt Mossberg will leave his post covering consumer tech at Wall Street Journal. The move comes after the newspaper's parent company News Corp. (NWS) did not renew its contract with AllThingsD, the tech site that Mossberg co-created with Kara Swisher. To top of page

Wednesday, May 13, 2015

Europe Is a Glass Half Full

Print FriendlyIn the latest of several reports indicating improvement, the European Commission recently said that its Economic Sentiment Indicator for the euro zone moved into positive territory this month for the first time in more than two years.

European stocks have been rising for more than a year. Many markets, including those of  Germany, France, Spain, the UK and Switzerland, hit new 52-week peaks just last week. They were finally joining US stocks, which have steadily reached higher levels this year, officially broadening the global bull market.

Another sign of reduced financial stress is that yields on government bonds of Italy and Spain, two troubled national economies that are respectively the third and fourth largest in the euro zone, are down sharply from last summer. Plus, the yield spreads compared with German government bonds have shrunk from more than five percentage points to about half that level.

Last year’s turning point came when European Central Bank President Mario Draghi, perhaps taking a cue from US Federal Reserve chairman Ben Bernanke, said: “Within our mandate, the ECB is ready to do whatever it takes to preserve the euro.”

The main step the ECB took at that time was to fund Europe’s banks with necessary cash via low-cost loans to banks to buy government bonds. This stemmed immediate fears of a euro collapse.

Amid considerable ongoing speculation about the health of European banks, Draghi this week pledged to pump more into the banks if that becomes necessary to avert a possible a credit crunch.

Now, at long last, growth is starting to turn positive. The latest forecast from the Organization for Economic Cooperation and Development (OECD) is that overall growth for the 17-nation euro zone will be negative again this year. But the OECD has raised its forecasts for several countries.

Germany, Europe’s biggest economy, should gro! w 0.7 percent in 2013, up from the May forecast of 0.4 percent, the OECD says. And France, the second largest, is seen on course for 2013 growth of 0.3 percent this year, compared with a projected contraction of 0.3 percent previously. Outside the euro zone, the UK is expected to grow 1.5 percent, up sharply from the previous 0.8 percent forecast.

Pimco, the world’s largest fixed-income investor, predicts that the euro zone overall will generate slightly positive inflation-adjusted growth in a range between zero and 0.5 percent over the next 12 months. That’s anemic, to put it generously. Nevertheless, it’s an improvement over the 0.5 percent decline in gross domestic product for the year ending in this year’s second quarter. Outside the euro zone, the UK economy is expected to grow 1.5 percent to 2 percent in the coming 12 months, which is downright robust by comparison.

Among other projections, Standard & Poor’s forecasts that the euro zone economy will shrink by 0.7 percent this year, before growing by 0.8 percent in 2014 and 1.3 percent in 2015. Goldman Sachs expects a 2013 contraction of 0.36 percent in 2013, and growth of 0.87 percent next year.

Another plus: While the euro zone has now had eight consecutive quarterly declines in employment, the latest was the smallest yet, with a drop of just 0.1 percent.

This very gradual economic improvement would still be inadequate to reduce the euro zone’s main problems, led by a record-high unemployment rate of 12.1 percent, hefty government debt, and uncompetitive labor costs, benefits and taxes.

What’s more, many uncertainties remain about even the sluggish growth that’s expected. For instance, new data from the ECB showed that bank lending to companies fell in all of the euro zone’s big countries in August.

Last Sunday, Angela Merkel was elected to her third term as German chancellor, also strengthening her position as Europe’s de facto leader.
Sometim! es referred to as “Frau Europa,” Merkel is the only major European leader to have weathered the financial crisis. Her center-right Christian Democratic Union party fell just short of an absolute majority, but no German chancellor has achieved that since 1957.

However, she may have to form a coalition with the opposition Social Democrats, who likely would demand an increased focus on domestic issues, possibly reducing Germany’s enthusiasm for spending more to bail out weaker euro zone neighbors.

Meanwhile, France, Italy and Spain all face significant economic challenges, with troubled political leadership.

So Europe is improving. Its blue-chip stocks generally are attractively valued and pay good income. But the road ahead will remain long and bumpy.

Tuesday, May 12, 2015

Computer glitch causes widespread JetBlue delays

jet blue computer glitch

Computer problems grounded JetBlue flights Friday morning.

NEW YORK (CNNMoney) JetBlue Airways was hit by a computer problem which caused widespread delays across its system on Friday.

The problem, which the airline described as a software problem affecting its computer system used to dispatch flights lasted for several hours, delaying at least 40 morning flights.

While the airline reported that the problem had been corrected by 10:30 a.m. ET, it said it expects further delays throughout the rest of the day. It asked that passengers check with the airline on the status of their flights.

Independent flight tracking service FlightStats reported that as of 11:30 a.m. 72% of JetBlue's departures for the day were on-time.

Commercial space travel just a year away   Commercial space travel just a year away

That's actually better than the 55% on-time performance it reported for JetBlue on Thursday, the day before the computer problem. A strong thunder storm hit the East Coast Thursday. JetBlue's flights are concentrated in the East Coast and the storm could have had a greater impact on flights. The airline had an 85% on-time performance on Wednesday that was more typical of its regular performance. To top of page

Sunday, May 10, 2015

Deconstructing DFA’s Secret Sauce

DFA diehards tend to be proud and protective of their relationship with the exclusive fund family — Dimensional Fund Advisors works with fewer than 2,000 advisors — known for its deep value orientation and emphasis on empirical financial research.

As befits the financial sophistication for which the firm is known, the latest paean to the fund firm’s superiority is a three-factor regression analysis that DFA advisor Eric Nelson of Servo Wealth Management has undertaken with a view toward understanding which factors account for DFA’s excess returns.

Writing on his blog, the Oklahoma City-based advisor seeks to show that DFA’s superior returns derive not merely from fund design characteristics — factors that lead some investors to favor ETFs over mutual funds or index funds over actively managed funds, for example; rather it is superior fund management that makes DFA funds advantageous.

To demonstrate this point, Nelson compares DFA funds over the past 15-plus years in two broad categories for which multiple index fund and ETF alternatives exist: large value funds and small value funds.

He looks at how the DFA fund compared with two iShares ETFs and a Vanguard index fund in each category, then isolates how much did each fund’s value orientation, small-cap bias and management alpha contribute to performance.

The analysis seems to show that DFA is a different sort of creature than these other value products.

For example, in the large-value category, DFA’s annualized return of 7.2% far exceeded the 4.9%, 5.8% and 5.2% returns of the iShares S&P 500 value index, iShares Russell 1000 and Vanguard Value Index Fund.

Part of the reason for that, Nelson explains, is the fund’s 0.6 value coefficient compared to value exposure in the other funds ranging from 0.3 to 0.4.

That means that when value beats growth, the DFA fund will capture 60% of the outperformance compared with its peers’ 30% to 40%. And DFA gets this deeper value orientation by buying low price-to-book ratio stocks in the bottom quartile rather than the bottom half as is common with index funds, resulting in a deeper value bias.

The more diluted stock selection of DFA’s peers “results in watered-down and stale portfolios with much lower returns,” Nelson writes.

The DFA fund also outperformed its exposure to small-cap and value stocks by 0.1% through alpha (compared to its peers’ -0.1 to -1%), meaning through portfolio management emphasizing patient trading and lending of securities for added portfolio income.

“We can conclude that between 20% and 50% of DFA’s outperformance in large value stocks, a sizable sum, has nothing to do with their increased value exposure,” Nelson writes.

In the small-cap value comparison, Nelson found that management expertise had an even greater impact, accounting from between 40% and 70% of DFA’s advantage over its peers — beyond its deeper value orientation and more pronounced tilt toward smaller stocks. What’s more, while DFA was consistently adding value in value exposure, size exposure and alpha, its peers evinced no such consistency:

“The best non-DFA index in the large value asset class, the Russell 1000 Value, was also the worst non-DFA index in the small value asset class, the Russell 2000 Value,” Nelson finds.

The Oklahoma City-based RIA concludes that fund management and fund design equally drive DFA’s performance edge:

“We find how DFA manages their portfolios (trading patiently, screening out non-asset class holdings, and generating securities lending revenue) on an ongoing basis is as important as how the portfolios are designed (greater orientation to small-cap stocks, deeper orientation to value stocks),” Nelson writes.

Despite these advantages, Nelson insists it is the advisor and not the fund company that makes the key difference in investor outcomes.

“Access to DFA is nice and they do a better job than other options, but the value we provide in developing an appropriate asset allocation and ensuring our clients stick with it through thick and thin is where the greatest value lies,” he tells ThinkAdvisor.

That said, Nelson is currently using DFA funds exclusively (though that is not a requirement that DFA imposes) for new clients — “not because…we are a ‘DFA advisor,’" he says, "but instead because in each asset class we use in a balanced portfolio (U.S. large growth, large-value, small-value, international large value, small value, emerging markets value, and global short-term bonds), we simply cannot find an ETF, Vanguard fund, or other passive strategy that is as diversified and captures the returns of the asset class as robustly and consistently as DFA does.”

---

Check out Your Move, Bogleheads: Advisor Finds DFA’s Returns Trump Vanguard’s on ThinkAdvisor.

Tuesday, April 28, 2015

Dollar Could Put in for a Natural Rebound or Explosive Rally

Dollar_Could_Put_in_for_a_Natural_Rebound_or_Explosive_Rally_body_Picture_5.png, Dollar Could Put in for a Natural Rebound or Explosive Rally
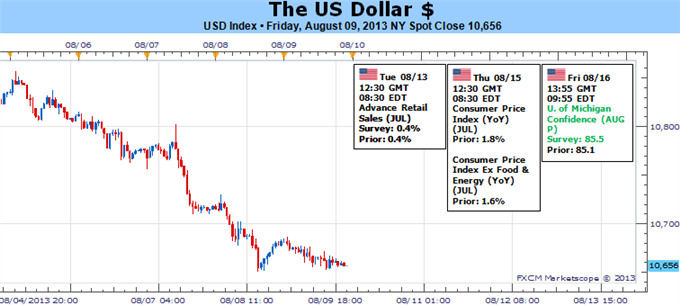
Dollar Could Put in for a Natural Rebound or Explosive RallyFundamental Forecast for US Dollar: BullishA range of Fed officials stay out of the way of the September Taper timetable US Treasury auctions show a slow rebound in foreign interest, but total demand weakening A strong showing in US service sector activity and trade reinforces growth, Taper outlook Over the past week, the Dow Jones FXCM Dollar Index (ticker = USDollar) suffered its worst weekly decline since December 2011 and its longest string of daily losses since December 2010. Taken without context, that is a strong bearish sign. However, when we consider the fundamental and technical backdrop; this situation looks like a launching point for a dollar rally. The question is whether it will be a mild, natural correction or an explosive rally with genuine trend generation. That outcome will be determined by the progress found on the market’s primary fundamental concerns: the market’s appetite for risk and speculation surrounding the Fed’s ‘Taper’.To understand where the dollar will move heading forward, we have to establish the conditions under which it has arrived at its current position. The slide through this past week was extraordinary for both its consistency and intensity. Yet, the slide evolved without the burden of the benchmark currency’s primary fundamental themes. Looking for evidence of a rebound in risk appetite; the speculative-favorite S&P 500 meandered – trading on the lowest non-holiday volume since the September 2011 terrorist attack – while other measures of sentiment similarly floundered. As for Taper premiums, both speeches by Fed officials’ speeches and data on the eco! nomic docket reinforced the probability of a September move by the central bank.Without conviction, the kind of move that we have seen this past week would more appropriately be labeled a ‘natural correction’. Though, traders know that such moves are temporary in nature without a strong shift in conviction and participation to change the underlying current. A simple look at market momentum, we find both the 100 and 200-day simple moving averages are below spot and rising steadily. So long as the systemic conditions behind the capital markets and investor sentiment don’t change, a return to trend for the greenback grows more likely with each day. Yet, the force of that transition depends on the accelerants available to facilitate it.The first thing we have to notice, is that the economic docket does not carry the kind of event risk that we would expect to definitively wipe out risk trends nor verify the September time frame for the Fed’s first reduction in its stimulus program. It is difficult to determine what known event risk short of the next FOMC rate decision (on September 18th) can carry enough influence to upset the current equilibrium. This past week, remarkably strong numbers for US trade and service-sector activity reinforced the more dubious – but positive – 2Q GDP and employment figures from the previous week. Furthermore, the Fed speeches from the period – particularly extreme dove Charles Evans – were clearly shaped to avoid contradicting expectations of a September start for the stimulus wind down. Yet, despite this combination, confidence in stimulus-backed speculative-position held fast. In the week ahead, we have another round of contributory data to the stimulus debate as well as central bank talks on tap; but these listings don’t seem to be any more convincing than what we have recently priced in. On Tuesday, non-voting Atlanta Fed President Dennis Lockhart (a hawk on QE) will speak on the economy, while voter St. Louis Fed Preside! nt James ! Bullard (a QE dove) is set to speak on monetary policy on Wednesday and the economy Thursday. For data, retail sales, the consumer price index and University of Michigan consumer sentiment survey are all notable.If this list of indicators and speeches can’t generate an explicit shift in risk trends, the natural ebb and flow will guide the dollar. Given the hefty move by the benchmark currency this past week despite the lack of drive, a rebound is likely. Yet, its potency and follow through will be questionable. Alternatively, should there be an innate shift in sentiment, the greenback can quickly return to its role as the market’s preferred reserve currency – for better or worse – and pitch into a serious trend.Looking at the backdrop for capital markets beyond S&P 500’s record highs, conditions looks highly suspect. This past week, volume on the S&P 500 was the lowest seen on a non-holiday period since the markets were closed after the September 2001 terrorist attacks in New York – an extension of a steady trend. Leverage used at the NYSE has moved to record highs. Exposure to exceptionally risky assets has grown. Retail interest in riskier assets has ramped up while ‘professional’ exposure has fled at the fastest pace in years. Meanwhile, volatility indicators show extreme complacency while rates of return are near record lows… - JKWritten by: John Kicklighter, Chief StrategistSign up for John’s email distribution list, here.original source

Monday, April 20, 2015

3 Humongous Health-Care Stocks This Week

After extensive research, number-crunching, sorting, and filtering, the results are in. Here are your three most humongous performers in the world of health-care this week.

Breathing easier
Array BioPharma (NASDAQ: ARRY  ) shares climbed nearly 18% this week. The company announced positive results from a phase 2 study of its experimental asthma drug ARRY-502.

The study included 184 patients with mild-to-moderate persistent allergic asthma. ARRY-502 met the study's primary endpoint of significant improvement in a key measure of lung function. Several secondary endpoints were also successfully met, including statistically significant improvement in asthma control and symptom-free days during treatment.

Piper Jaffray bumped its price target for Array up from $7 to $10 after the good results were announced. That represents more than a 50% upside potential from the stock's current price. Array says that it's now looking for an "appropriate partner" to help complete development and potentially market ARRY-502.

An "alley-oop" from the opponent
Prosensa (NASDAQ: RNA  ) shares made something of a slam dunk this week, jumping more than 16%. That dunk was made with what amounts to an "alley-oop" from its primary rival, Sarepta Therapeutics (NASDAQ: SRPT  ) .

Sarepta announced on Thursday that it plans to seek approval for Duchenne muscular dystrophy, or DMD, drug eteplirsen without assurances from the Food and Drug Administration about an accelerated approval pathway. The biotech completed a phase 2 study for eteplirsen that showed impressive results. However, the small number of patients involved could present a hurdle for FDA approval.

In the meantime, Prosensa, along with partner GlaxoSmithKline (NYSE: GSK  ) , continue to plug ahead with a phase 3 study of DMD drug drisapersen that includes 186 participants -- much larger than the 12 boys in Sarepta's mid-stage study. Initial results from the study are expected in late 2013. An FDA approval could be forthcoming as early as the second half of next year.

Lunging forward
Intermune (NASDAQ: ITMN  ) announced second-quarter earnings on Wednesday. Higher-than-expected revenue helped shares advance almost 16% for the week.

The company's good news stemmed from strong sales growth for Esbriet, which is used in the treatment of idiopathic pulmonary fibrosis, a progressive form of lung disease. Intermune reported that sales of the drug were $14.4 million during the second quarter. Analysts expected $12 million.

With solid sales in the last quarter, Intermune now expects full-year revenue of $55 million to $70 million. That's a nice jump from the previous revenue guidance of $40 million to $55 million.

Esbriet was first launched in Germany in 2011. Intermune has rolled the drug out in 13 other European nations. However, the big U.S. market still remains to be tapped. The FDA rejected approval of Esbriet in 2010. Intermune has a late-stage test under way in the U.S. with results expected in the second quarter of 2014.

Best of the best
It's a tough decision between this week's humongous stocks as to which is the best pick. All three have had great years thus far and have potential to keep moving up.

All things considered, though, my hunch is to go with Array BioPharma. It's been a long time since a new allergic asthma drug has been introduced. Array definitely needs a partner to tackle the huge asthma market. I think it will find one and do well in the years ahead.

You might love the thrill of high-flying biotech stocks, but it's those ho-hum dividend stocks that can improve your odds the most of getting rich over time.Over the long term, the compounding effect of the quarterly payouts, as well as their growth, adds up faster than most investors imagine. With this in mind, our analysts sat down to identify the absolute best of the best when it comes to rock-solid dividend stocks, drawing up a list in this free report of the only nine that fit the bill. To discover the identities of these companies before the rest of the market catches on, you can download this valuable free report by simply clicking here now.

Tuesday, April 14, 2015

Your iPad Is Begging to Do So Much More

Second-screen technology was one of the big topics at the recent Cable Show in Washington, D.C. Motley Fool analyst Rex Moore was at the event and chatted with Akamai's (NASDAQ: AKAM  ) Kris Alexander about how so-called "couch commerce" is opening up new revenue streams for retailers, advertisers, and programmers.

In this segment, Kris talks about the explosion of connected devices such as Apple's (NASDAQ: AAPL  ) iPads and Google's (NASDAQ: GOOG  ) Android tablets, and what it means for second-screen commerce.

Looking for the top dog
It's incredible to think just how much of our digital and technological lives are almost entirely shaped and molded by just a handful of companies. Find out "Who Will Win the War Between the 5 Biggest Tech Stocks" in The Motley Fool's latest free report, which details the knock-down, drag-out battle being waged among the five kings of tech. Click here to keep reading.