Sunday, May 31, 2015

Ralph Lauren Corp. (RL) Q4 Earnings Preview: Clearance Sales To Hurt Margins?

Ralph Lauren Corp (NYSE:RL) will release its Fourth Quarter and Full Year Fiscal 2014 results for the period ended March 29, 2014 at approximately 8:00 A.M. Eastern, Friday, May 9, 2014. At 9:00 A.M. Eastern, on the same day, the Company will host a conference call for analysts, investors and other interested parties.

Wall Street anticipates that the clothing company will earn $1.63 per share for the quarter, which is $0.22 more than last year's profit of $1.41 per share. iStock expects Ralph Lauren to beat Wall Street's consensus number. The iEstimate is $1.68, a nickel more than expected.

[Related -Ralph Lauren Corp (RL): A Deeper Look Into Ralph Lauren's Stock]

Sales, like earnings, are expected to increase, rising by 11.3% year-over-year (YoY). RL's consensus revenue estimate for Q4 is $1.83 billion, more than last year's $1.64 billion.

Ralph Lauren Corporation is engaged in the design, marketing and distribution of products, including men's, women's and children's apparel, accessories (including footwear), fragrances and home furnishings. The Company operates in three segments: Wholesale, Retail and Licensing.

Beating estimates is nothing new for the fashion company. Ralph Lauren's profits have exceeded Wall Street's consensus number 14 of the last 16 quarters. EPS were on-target for the two outstanding quarterly checkups. On average, RL actual profits bypass projected EPS by $0.23 with a range of $0.11 to $0.50 more than forecasted. That's makes the iEstimate look small by comparison.

[Related -Stocks Close Lower Amid China Data; HP Jumps]

For the most part, RL's earnings-driven, price sensitivity has tracked the bullish nature of earnings announcements. The stock price moved higher 10 of the last 16 quarters, gaining anywhere from 2.2% to 13% with an average increase of 7.28%. Meanwhile, RL's price backed up a half-dozen times by an average of 3.93%.

Unfortunately for shareholders, May has been the worst performing quarter. Shares lost ground three of the last four emerald month announcements, dropping -2.9%, -4.4%, and -4.9% in the days surrounding the news. Once, May 2012, RL managed a 3.8% gain.

For most retailers, margins are the key to bullish or bearish surprises. As it is with RL, we do have some concerns in this regard for Friday morning. In Q3, the cost of goods sold increased 8.34% versus sales gains of 3.08%.  It might now sound like too big of a deal, but it's a $40 million difference had costs increased at the same pace as sales. It works out to $0.45 per share.

RL's balance sheet has some margin eyesores, too. Inventory was up 35.6% during the third quarter, which could mean clearance sales in Q4 i.e. smaller profit margins. Additionally, some customers might be slow to pay their bills as account receivables climbed 25.98%.

Overall: Ralph Lauren Corp (NYSE:RL) history and iEstimate suggest another bullish surprise is coming. However, RL's financial statements raise some concerns. The may not show up this quarter, but they will eventually if not corrected. 

Thursday, May 28, 2015

3 Stocks Spiking on Unusual Volume

DELAFIELD, Wis. (Stockpickr) -- Professional traders running mutual funds and hedge funds don't just look at a stock's price moves; they also track big changes in volume activity. Often when above-average volume moves into an equity, it precedes a large spike in volatility.

>>5 Rocket Stocks for a Tumbling Market

Major moves in volume can signal unusual activity, such as insider buying or selling -- or buying or selling by "superinvestors."

Unusual volume can also be a major signal that hedge funds and momentum traders are piling into a stock ahead of a catalyst. These types of traders like to get in well before a large spike, so it's always a smart move to monitor unusual volume. That said, remember to combine trend and price action with unusual volume. Put them all together to help you decipher the next big trend for any stock.

>>5 Stocks Insiders Love Right Now

With that in mind, let's take a look at several stocks rising on unusual volume recently.

Post

Post (POST) manufactures, markets and distributes ready-to-eat cereals, snacks and active nutrition products in the U.S. and Canada. This stock closed up 5.6% to $54.73 in Wednesday's trading session.

Wednesday's Volume: 1.72 million

Three-Month Average Volume: 576,016

Volume % Change: 202%

From a technical perspective, POST ripped higher here right above its recent low of $50.45 with strong upside volume. This move briefly pushed shares of POST back above its 50-day moving average of $55.52, before the stock closed just below that level at $54.73. Shares of POST are now quickly moving within range of triggering a near-term breakout trade. That trade will hit if POST manages to take out some near-term overhead resistance levels at $55.71 to Wednesday's high of $55.76 with high volume.

Traders should now look for long-biased trades in POST as long as it's trending above Wednesday's low of $51.83 and then once it sustains a move or close above those breakout levels with volume that hits near or above 576,016 shares. If that breakout materializes soon, then POST will set up to re-test or possibly take out its next major overhead resistance levels at $59.97 to its 52-week high at $60.63.

SodaStream International

SodaStream International (SODA) engages in the development, manufacture and sale of home beverage carbonation systems that enable consumers to transform ordinary tap water instantly into carbonated soft drinks and sparkling water. This stock closed up 8.1% at $40.75 in Wednesday's trading session.

Wednesday's Volume: 3.98 million

Three-Month Average Volume: 1.55 million

Volume % Change: 143%

From a technical perspective, SODA gapped up sharply higher here and closed right on its 50-day moving average of $40.75 with strong upside volume. This gap is coming after shares of SODA recently pulled back from $45.20 to its recent low of $37.16. That low occurred right near some previous support at $37. Market players should now look for a continuation move higher in the short-term if SODA manages to take out Wednesday's high of $42.25 to more resistance at $42.50 with strong volume.

Traders should now look for long-biased trades in SODA as long as it's trending above Wednesday's low of $40.20 or above $39 and then once it sustains a move or close above $42.25 to $42.50 with volume that this near or above 1.55 million shares. If that move materializes soon, then SODA will set up to re-test or possibly take out its next major overhead resistance level at $45.20. Any high-volume move above $45.20 will then give SODA a chance to re-fill some of its previous gap-down-day zone from January that started just above $50.

Voxeljet AG

Voxeljet AG (VJET) provides three-dimensional printers and on-demand parts services to industrial and commercial customers. This stock closed up 9.2% at $16.17 in Wednesday's trading session.

Wednesday's Volume: 1.36 million

Three-Month Average Volume: 541,534

Volume % Change: 165%

From a technical perspective, VJET skyrocketed sharply higher here right above some near-term support at $14.06 with strong upside volume. This stock has been downtrending badly over the last month and change, with shares moving lower from its high of $37.49 to its recent low of $14.06. During that slide, shares of VJET have been consistently making lower highs and lower lows, which is bearish technical price action. That move pushed shares of VJET into oversold territory, since its current relative strength index reading is 23.60. Shares of VJET are now starting to rip higher off oversold levels and it has started to trade inside of its gap-down-day zone from earlier this month that started above $20.

Traders should now look for long-biased trades in VJET as long as it's trending above Wednesday's low of $14.90 and then once it sustains a move or close above Wednesday's high of $16.65 with volume that hits near or above 541,534 shares. If we get that move soon, then VJET will set up to re-fill some more of that gap-down-day zone that started just above $20.

To see more stocks rising on unusual volume, check out the Stocks Rising on Unusual Volume portfolio on Stockpickr.

-- Written by Roberto Pedone in Delafield, Wis.


RELATED LINKS:


>>2 Oversold Stocks Ready to Bounce Higher


>>5 Stocks Set to Soar on Bullish Earnings


>>5 REIT Trades Worth Buying in April

Follow Stockpickr on Twitter and become a fan on Facebook.

At the time of publication, author had no positions in stocks mentioned.

Roberto Pedone, based out of Delafield, Wis., is an independent trader who focuses on technical analysis for small- and large-cap stocks, options, futures, commodities and currencies. Roberto studied international business at the Milwaukee School of Engineering, and he spent a year overseas studying business in Lubeck, Germany. His work has appeared on financial outlets including

CNBC.com and Forbes.com. You can follow Pedone on Twitter at www.twitter.com/zerosum24 or @zerosum24.


Stocks Going Ex-Dividend on Friday, April 11 (ABBV, ABT, More)

Ex-dividend dates are very important to dividend investors, since you must purchase a stock prior to its ex-dividend date in order to receive its upcoming dividend payout. For more information, check out Everything Investors Need to Know About Ex-Dividend Dates.

Below we highlight seven big-name stocks going ex-dividend on Friday, April 11.

1. AbbVie Inc.

AbbVie Inc. (ABBV) offers a dividend yield of 3.32% based on Wednesday's closing price of $50.63 and the company's quarterly dividend payout of 42 cents. The stock is down 2.6% year-to-date. Dividend.com currently rates ABBV as “Recommended” with a DARS™ rating of 3.5 stars out of 5 stars.
2. Abbott Labs

Abbott Labs (ABT) offers a dividend yield of 2.34% based on Wednesday's closing price of $37.63 and the company's quarterly dividend payout of 22 cents. The stock is down 1.57% year-to-date. Dividend.com currently rates ABT as “Neutral” with a DARS™ rating of 3.4 stars out of 5 stars.

3. Trinity Industries

Trinity Industries (

Wednesday, May 27, 2015

Stocks mostly higher after Japan jump

Stocks tilted mostly higher on Tuesday as Japan's central bank announced new measures to support growth and Wall Street wondered if the stock market can build on its best weekly gain of the year and climb to a new record.

The Nikkei 225 in Tokyo leaped 3.1% to 14,843.24 after the Bank of Japan said it was doubling the size of its fund to support bank lending and its fund to support economic growth.

U.S. investors were also digesting the release of another disappointing economic report during a period of stormy winter weather. A gauge of manufacturing in the New York region, the so-called Empire State manufacturing index, came in lower than expected at 4.48 in February, down from 12.51 in January and below the estimate of 8.5.

COKE: U.S. soda sales down

In afternoon trading the Dow Jones industrial average was fractionally negative while the Standard & Poor's 500 index and the Nasdaq composite were up 0.2% and 0.7%, respectively.

The Dow could be weighed down by Coca-Cola on Tuesday. The beverage maker reported earnings in line with Wall Street expectations but reported revenues below estimates due to a 1% sales drop in North America caused by a drop in soda sales. In pre-market trading Coke shares were down 1.9% to $38.21.

U.S. markets were closed Monday for the Presidents' Day national holiday. On Friday, U.S. stocks closed higher as the market's recent rally helped cap off the biggest weekly gain of 2014.

Heading into today's trading session, the benchmark S&P 500, which had declined 5.76% through Feb. 3, was within a half of a percentage point of topping its Jan. 15 record high of 1848.38. If the large-company stock index can close at a new high, it would mark an official end to the "pullback" and, perhaps, quell talk of a pending correction, or a drop of 10% or more.

"The S&P 500 had another strong day on Friday, and looks poised to test the recent all-time highs around 1,850," said Schaeffer's Investment Research's senior trading analyst ! Bryan Sapp. The S&P 500 closed Friday at 1838.63, roughly 10 points below its record peak.

In deal news, Dublin-headquartered Actavis said Tuesday it will acquire rival New York-based drug maker Forest Laboratories in a deal valued at approximately $25 billion. News of the deal sent Forest's pre-market shares surging over 30%. Actavis's NYSE-listed pre-market shares leaped 15% before its gains were trimmed to 8%.

FRIDAY: Stocks close with best weekly gains of the year

Benchmark U.S. oil for March delivery was up 35 cents to $100.65 a barrel in electronic trading on the New York Mercantile Exchange. The contract last settled on Friday.

Contributing: Associated Press

Monday, May 25, 2015

2 Stocks Rising on Unusual Volume

 DELAFIELD, Wis. (Stockpickr) -- Professional traders running mutual funds and hedge funds don't just look at a stock's price moves; they also track big changes in volume activity. Often when above-average volume moves into an equity, it precedes a large spike in volatility.

>>4 Big Stocks on Traders' Radars

Major moves in volume can signal unusual activity, such as insider buying or selling -- or buying or selling by "superinvestors."

Unusual volume can also be a major signal that hedge funds and momentum traders are piling into a stock ahead of a catalyst. These types of traders like to get in well before a large spike, so it's always a smart move to monitor unusual volume. That said, remember to combine trend and price action with unusual volume. Put them all together to help you decipher the next big trend for any stock. >>5 Low-Priced Stocks to Trade for Gains With that in mind, let's take a look at several stocks rising on unusual volume recently.

Stock quotes in this article: ICLR, UFS, 
 

Icon

Icon (ICLR) a contract research organization, provides outsourced development services to the pharmaceutical, biotechnology and medical device industries primarily in Ireland, the U.S. and rest of Europe. This stock closed up 3.5% to $43.61 in Wednesday's trading session.

Wednesday's Volume: 562,000
Three-Month Average Volume: 372,292
Volume % Change: 80%

>>5 Ways to Invest Like a Pension Fund From a technical perspective, ICLR jumped higher here right above some near-term support at $41 with above-average. This stock has been uptrending strong for the last two months, with shares moving higher from its low of $36.42 to its intraday high of $43.70. During that uptrend, shares of ICLR have been consistently making higher lows and higher highs, which is bullish technical price action. That move has now pushed shares of ICLR within range of triggering a big breakout trade. That trade will hit if ICLR manages to take out Wednesday's high of $43.70 to its 52-week high at $44.23 with high volume. Traders should now look for long-biased trades in ICLR as long as it's trending above $41 or above its 50-day at $40 and then once it sustains a move or close above those breakout levels with volume that hits near or above 372,292 shares. If that breakout hits soon, then ICLR will set up to enter new 52-week-high territory, which is bullish technical price action. Some possible upside targets off that breakout are $50 to $55.

Stock quotes in this article: ICLR, UFS, 
 

Domtar

Domtar (UFS) designs, manufactures, markets and distributes communications papers, specialty and packaging papers, and adult incontinence products worldwide. This stock closed up 1.1% at $106 in Wednesday's trading session.

Wednesday's Volume: 1.89 million
Three-Month Average Volume: 367,447
Volume % Change: 416%

>>5 Stocks Set to Soar on Bullish Earnings From a technical perspective, UFS trended modestly higher here right above some near-term support at $100 with heavy upside volume. This move is quickly pushing shares of UFS within range of triggering a near-term breakout trade. That trade will hit if UFS manages to take out some near-term overhead resistance at $108 to its 52-week high at $110.20 with high volume. Traders should now look for long-biased trades in UFS as long as it's trending above some near-term support at $100 and then once it sustains a move or close above those breakout levels with volume that this near or above 367,447 shares. If that breakout hits soon, then UFS will set up to enter new 52-week-high territory, which is bullish technical price action. Some possible upside targets off that breakout are $120 to $130. To see more stocks rising on unusual volume, check out the Stocks Rising on Unusual Volume portfolio on Stockpickr. -- Written by Roberto Pedone in Delafield, Wis. RELATED LINKS:   >>3 Huge Stocks to Trade (or Not) >>3 Tech Stocks Under $10 to Watch >>5 Hated Earnings Stocks You Should Love Follow Stockpickr on Twitter and become a fan on Facebook.

Stock quotes in this article: ICLR, UFS, 
  At the time of publication, author had no positions in stocks mentioned. Roberto Pedone, based out of Delafield, Wis., is an independent trader who focuses on technical analysis for small- and large-cap stocks, options, futures, commodities and currencies. Roberto studied international business at the Milwaukee School of Engineering, and he spent a year overseas studying business in Lubeck, Germany. His work has appeared on financial outlets including CNBC.com and Forbes.com. You can follow Pedone on Twitter at www.twitter.com/zerosum24 or @zerosum24.

Sunday, May 24, 2015

Can Apple Continue to Outperform?

With shares of Apple (NASDAQ:AAPL) trading around $560, is AAPL an OUTPERFORM, WAIT AND SEE or STAY AWAY? Let's analyze the stock with the relevant sections of our CHEAT SHEET investing framework:

T = Trends for a Stock’s Movement

Apple designs, manufactures, and markets mobile communication and media devices, personal computers, portable digital music players, and a variety of related software, services, peripherals, networking solutions, third-party digital content, and applications. The company's products and services include the iPhone, iPad, Mac, iPod, Apple TV, a portfolio of consumer and professional software applications, the iOS and OS X operating systems, iCloud, and further accessory, service, and support offerings. Apple also delivers digital content and applications through its iTunes, App, iBook, and Mac App stores.

Since a federal appeals court weighed in on Apple's smartphone war with Samsung (SSNLF.PK) last month, the iPhone-maker's quest to implement a sales ban against its rival's devices has gained a new lease on life. Smartphones have created a nearly $300 billion industry, and the battle to control market share is no longer limited to winning over customers. Equally important is protecting the ideas behind the innovations that propel the multi-billion industry forward.

T = Technicals on the Stock Chart Are Strong

Apple stock has struggled to make significant progress in the last several quarters. The stock is currently pulling back and may need time to consolidate before heading higher. Analyzing the price trend and its strength can be done using key simple moving averages. What are the key moving averages? The 50-day (pink), 100-day (blue), and 200-day (yellow) simple moving averages. As seen in the daily price chart below, Apple is trading above its rising key averages, which signal neutral to bullish price action in the near-term.

AAPL

(Source: Thinkorswim)

Taking a look at the implied volatility (red) and implied volatility skew levels of Apple options may help determine if investors are bullish, neutral, or bearish.

Implied Volatility (IV)

30-Day IV Percentile

90-Day IV Percentile

Apple options

27.87%

86%

83%

What does this mean? This means that investors or traders are buying a very significant amount of call and put options contracts, as compared to the last 30 and 90 trading days.

Put IV Skew

Call IV Skew

January Options

Flat

Average

February Options

Flat

Average

As of today, there is an average demand from call buyers or sellers and low demand by put buyers or high demand by put sellers, all neutral to bullish over the next two months. To summarize, investors are buying a very significant amount of call and put option contracts and are leaning neutral to bullish over the next two months.

On the next page, let’s take a look at the earnings and revenue growth rates and the conclusion.

E = Earnings Are Miixed Quarter-Over-Quarter

Rising stock prices are often strongly correlated with rising earnings and revenue growth rates. Also, the last four quarterly earnings announcement reactions help gauge investor sentiment on Apple’s stock. What do the last four quarterly earnings and revenue growth (Y-O-Y) figures for Apple look like and more importantly, how did the markets like these numbers?

2013 Q3

2013 Q2

2013 Q1

2012 Q4

Earnings Growth (Y-O-Y)

-4.73%

-19.85%

-17.97%

-0.43%

Revenue Growth (Y-O-Y)

4.19%

0.86%

11.27%

17.65%

Earnings Reaction

-2.49%

5.13%

-0.16%

-12.35%

Apple has seen decreasing earnings and increasing revenue figures over the last four quarters. From these numbers, the markets have been pleased with Apple’s recent earnings announcements.

P = Average Relative Performance Versus Peers and Sector

How has Apple stock done relative to its peers, Google (NASDAQ:GOOG), Microsoft (NASDAQ:MSFT), BlackBerry (NASDAQ:BBRY), and sector?

Apple

Google

Microsoft

BlackBerry

Sector

Year-to-Date Return

9.25%

57.19%

38.61%

-37.70%

4.38%

Apple has been an average performer, year-to-date.

Conclusion

Apple strives to provide innovative products and services that consumers and companies love to own. Since a federal appeals court weighed in on Apple's smartphone war with Samsung last month, the iPhone-maker's quest to implement a sales ban against its rival's devices has gained a new lease on life. The stock hasn't made significant progress in the last several years, but is currently pulling back. Over the last four quarters, earnings have been decreasing while revenues have been rising, which has left investors pleased. Relative to its peers and sector, Apple has been an average year-to-date performer. Look for Apple to OUTPERFORM.

Tuesday, May 19, 2015

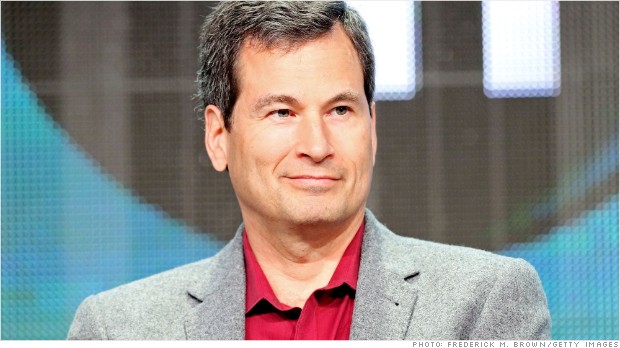
Yahoo poaches NYT tech columnist David Pogue

david pogue yahoo

David Pogue is leaving the New York Times after 13 years.

NEW YORK (CNNMoney) From the Gray Lady to the Big Purple Turnaround: Yahoo has poached famed New York Times tech columnist David Pogue to head up its consumer-tech coverage.

Pogue will lead a "major expansion" of Yahoo's tech coverage on a new website starting later this year, the company said.

Under CEO Marissa Mayer's leadership, Yahoo (YHOO, Fortune 500) has been working to launch big new initiatives while streamlining its focus. Pogue acknowledged Yahoo's underdog status and noted that he has "given them a few swift kicks myself over the years." But the columnist said he is impressed by Mayer, and she is the main reason he was willing to leave the Times (NYT) after 13 years.

"This is a company that's young, revitalized, aggressive -- and, under Marissa Mayer's leadership, razor-focused, for the first time in years," Pogue wrote on Tumblr, the blog site that Yahoo bought in May.

And in poaching Pogue, Mayer has scored another splashy addition for Yahoo.

Pogue's columns about consumer gadgets and services have appeared in the Times every Thursday since 2000. His humorous, approachable and influential reviews are highly sought after by tech companies and widely read by consumers.

Related story: Marissa Mayer at Fortune's Most Powerful Women conference

Pogue will start at Yahoo in a few weeks, he said in his blog post. In addition to publishing columns, blog posts and videos, he also has plans "for all kinds of online and real-world creations."

Pogue, a 25-year industry veteran, is also a bestselling author, a columnist at Scientific American, and a correspondent on both CBS (CBS, Fortune 500) and PBS. He'll keep those side jobs after his jump to Yahoo.

The Times isn't the only newspaper to lose its star tech columnist recently. Last month, news broke that Walt Mossberg will leave his post covering consumer tech at Wall Street Journal. The move comes after the newspaper's parent company News Corp. (NWS) did not renew its contract with AllThingsD, the tech site that Mossberg co-created with Kara Swisher. To top of page

Wednesday, May 13, 2015

Europe Is a Glass Half Full

Print FriendlyIn the latest of several reports indicating improvement, the European Commission recently said that its Economic Sentiment Indicator for the euro zone moved into positive territory this month for the first time in more than two years.

European stocks have been rising for more than a year. Many markets, including those of  Germany, France, Spain, the UK and Switzerland, hit new 52-week peaks just last week. They were finally joining US stocks, which have steadily reached higher levels this year, officially broadening the global bull market.

Another sign of reduced financial stress is that yields on government bonds of Italy and Spain, two troubled national economies that are respectively the third and fourth largest in the euro zone, are down sharply from last summer. Plus, the yield spreads compared with German government bonds have shrunk from more than five percentage points to about half that level.

Last year’s turning point came when European Central Bank President Mario Draghi, perhaps taking a cue from US Federal Reserve chairman Ben Bernanke, said: “Within our mandate, the ECB is ready to do whatever it takes to preserve the euro.”

The main step the ECB took at that time was to fund Europe’s banks with necessary cash via low-cost loans to banks to buy government bonds. This stemmed immediate fears of a euro collapse.

Amid considerable ongoing speculation about the health of European banks, Draghi this week pledged to pump more into the banks if that becomes necessary to avert a possible a credit crunch.

Now, at long last, growth is starting to turn positive. The latest forecast from the Organization for Economic Cooperation and Development (OECD) is that overall growth for the 17-nation euro zone will be negative again this year. But the OECD has raised its forecasts for several countries.

Germany, Europe’s biggest economy, should gro! w 0.7 percent in 2013, up from the May forecast of 0.4 percent, the OECD says. And France, the second largest, is seen on course for 2013 growth of 0.3 percent this year, compared with a projected contraction of 0.3 percent previously. Outside the euro zone, the UK is expected to grow 1.5 percent, up sharply from the previous 0.8 percent forecast.

Pimco, the world’s largest fixed-income investor, predicts that the euro zone overall will generate slightly positive inflation-adjusted growth in a range between zero and 0.5 percent over the next 12 months. That’s anemic, to put it generously. Nevertheless, it’s an improvement over the 0.5 percent decline in gross domestic product for the year ending in this year’s second quarter. Outside the euro zone, the UK economy is expected to grow 1.5 percent to 2 percent in the coming 12 months, which is downright robust by comparison.

Among other projections, Standard & Poor’s forecasts that the euro zone economy will shrink by 0.7 percent this year, before growing by 0.8 percent in 2014 and 1.3 percent in 2015. Goldman Sachs expects a 2013 contraction of 0.36 percent in 2013, and growth of 0.87 percent next year.

Another plus: While the euro zone has now had eight consecutive quarterly declines in employment, the latest was the smallest yet, with a drop of just 0.1 percent.

This very gradual economic improvement would still be inadequate to reduce the euro zone’s main problems, led by a record-high unemployment rate of 12.1 percent, hefty government debt, and uncompetitive labor costs, benefits and taxes.

What’s more, many uncertainties remain about even the sluggish growth that’s expected. For instance, new data from the ECB showed that bank lending to companies fell in all of the euro zone’s big countries in August.

Last Sunday, Angela Merkel was elected to her third term as German chancellor, also strengthening her position as Europe’s de facto leader.
Sometim! es referred to as “Frau Europa,” Merkel is the only major European leader to have weathered the financial crisis. Her center-right Christian Democratic Union party fell just short of an absolute majority, but no German chancellor has achieved that since 1957.

However, she may have to form a coalition with the opposition Social Democrats, who likely would demand an increased focus on domestic issues, possibly reducing Germany’s enthusiasm for spending more to bail out weaker euro zone neighbors.

Meanwhile, France, Italy and Spain all face significant economic challenges, with troubled political leadership.

So Europe is improving. Its blue-chip stocks generally are attractively valued and pay good income. But the road ahead will remain long and bumpy.

Tuesday, May 12, 2015

Computer glitch causes widespread JetBlue delays

jet blue computer glitch

Computer problems grounded JetBlue flights Friday morning.

NEW YORK (CNNMoney) JetBlue Airways was hit by a computer problem which caused widespread delays across its system on Friday.

The problem, which the airline described as a software problem affecting its computer system used to dispatch flights lasted for several hours, delaying at least 40 morning flights.

While the airline reported that the problem had been corrected by 10:30 a.m. ET, it said it expects further delays throughout the rest of the day. It asked that passengers check with the airline on the status of their flights.

Independent flight tracking service FlightStats reported that as of 11:30 a.m. 72% of JetBlue's departures for the day were on-time.

Commercial space travel just a year away   Commercial space travel just a year away

That's actually better than the 55% on-time performance it reported for JetBlue on Thursday, the day before the computer problem. A strong thunder storm hit the East Coast Thursday. JetBlue's flights are concentrated in the East Coast and the storm could have had a greater impact on flights. The airline had an 85% on-time performance on Wednesday that was more typical of its regular performance. To top of page

Sunday, May 10, 2015

Deconstructing DFA’s Secret Sauce

DFA diehards tend to be proud and protective of their relationship with the exclusive fund family — Dimensional Fund Advisors works with fewer than 2,000 advisors — known for its deep value orientation and emphasis on empirical financial research.

As befits the financial sophistication for which the firm is known, the latest paean to the fund firm’s superiority is a three-factor regression analysis that DFA advisor Eric Nelson of Servo Wealth Management has undertaken with a view toward understanding which factors account for DFA’s excess returns.

Writing on his blog, the Oklahoma City-based advisor seeks to show that DFA’s superior returns derive not merely from fund design characteristics — factors that lead some investors to favor ETFs over mutual funds or index funds over actively managed funds, for example; rather it is superior fund management that makes DFA funds advantageous.

To demonstrate this point, Nelson compares DFA funds over the past 15-plus years in two broad categories for which multiple index fund and ETF alternatives exist: large value funds and small value funds.

He looks at how the DFA fund compared with two iShares ETFs and a Vanguard index fund in each category, then isolates how much did each fund’s value orientation, small-cap bias and management alpha contribute to performance.

The analysis seems to show that DFA is a different sort of creature than these other value products.

For example, in the large-value category, DFA’s annualized return of 7.2% far exceeded the 4.9%, 5.8% and 5.2% returns of the iShares S&P 500 value index, iShares Russell 1000 and Vanguard Value Index Fund.

Part of the reason for that, Nelson explains, is the fund’s 0.6 value coefficient compared to value exposure in the other funds ranging from 0.3 to 0.4.

That means that when value beats growth, the DFA fund will capture 60% of the outperformance compared with its peers’ 30% to 40%. And DFA gets this deeper value orientation by buying low price-to-book ratio stocks in the bottom quartile rather than the bottom half as is common with index funds, resulting in a deeper value bias.

The more diluted stock selection of DFA’s peers “results in watered-down and stale portfolios with much lower returns,” Nelson writes.

The DFA fund also outperformed its exposure to small-cap and value stocks by 0.1% through alpha (compared to its peers’ -0.1 to -1%), meaning through portfolio management emphasizing patient trading and lending of securities for added portfolio income.

“We can conclude that between 20% and 50% of DFA’s outperformance in large value stocks, a sizable sum, has nothing to do with their increased value exposure,” Nelson writes.

In the small-cap value comparison, Nelson found that management expertise had an even greater impact, accounting from between 40% and 70% of DFA’s advantage over its peers — beyond its deeper value orientation and more pronounced tilt toward smaller stocks. What’s more, while DFA was consistently adding value in value exposure, size exposure and alpha, its peers evinced no such consistency:

“The best non-DFA index in the large value asset class, the Russell 1000 Value, was also the worst non-DFA index in the small value asset class, the Russell 2000 Value,” Nelson finds.

The Oklahoma City-based RIA concludes that fund management and fund design equally drive DFA’s performance edge:

“We find how DFA manages their portfolios (trading patiently, screening out non-asset class holdings, and generating securities lending revenue) on an ongoing basis is as important as how the portfolios are designed (greater orientation to small-cap stocks, deeper orientation to value stocks),” Nelson writes.

Despite these advantages, Nelson insists it is the advisor and not the fund company that makes the key difference in investor outcomes.

“Access to DFA is nice and they do a better job than other options, but the value we provide in developing an appropriate asset allocation and ensuring our clients stick with it through thick and thin is where the greatest value lies,” he tells ThinkAdvisor.

That said, Nelson is currently using DFA funds exclusively (though that is not a requirement that DFA imposes) for new clients — “not because…we are a ‘DFA advisor,’" he says, "but instead because in each asset class we use in a balanced portfolio (U.S. large growth, large-value, small-value, international large value, small value, emerging markets value, and global short-term bonds), we simply cannot find an ETF, Vanguard fund, or other passive strategy that is as diversified and captures the returns of the asset class as robustly and consistently as DFA does.”

---

Check out Your Move, Bogleheads: Advisor Finds DFA’s Returns Trump Vanguard’s on ThinkAdvisor.