BALTIMORE (Stockpickr) -- There's something about low-priced stocks that gets investors' motors running. That's the only explanation for the elevated trading volumes in the under-$10 stocks. And as the market sleeps off its hangover after a pretty nasty session yesterday, there are some big trades to be made in the smallest stocks.
>>Where's the S&P Headed From Here? Higher!
To be clear, a low share price doesn't necessarily mean that we're talking about a small company, or a "cheap" one by valuation standards. In fact, by itself, share price isn't a very useful metric at all. But it's true that lower-priced names tend to trade more actively than pricier stocks of similar market capitalization.
And that liquid trading means that some actionable technical setups are bound to pop up. Today, we'll take a closer look at five of them.
For the unfamiliar, technical analysis is a way for investors to quantify qualitative factors, such as investor psychology, based on a stock's price action and trends. Once the domain of cloistered trading teams on Wall Street, technicals can help top traders make consistently profitable trades and can aid fundamental investors in better planning their stock execution.
>>5 Hated Earnings Stocks You Should Buy
Without further ado, let's take a look at five technical setups worth trading now.
Wendy's
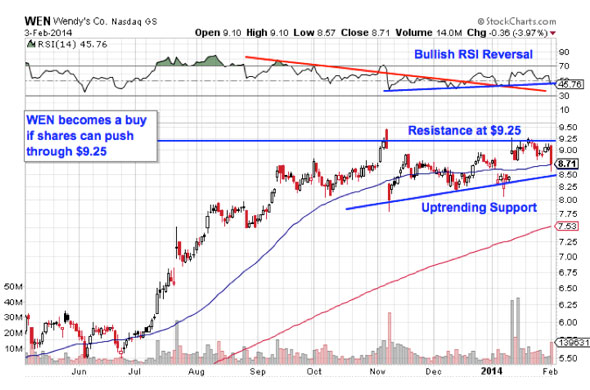
First up is fast food chain Wendy's (WEN). While most consumers think of Wendy's as one of the big burger chains, the firm's valuation weighs in at just one-thirtieth the capitalization of blue-chip rival McDonald's (MCD). But its sub-$10 price tag has helped to spur exciting trading in shares this week.
>>5 Stocks Under $10 Set to Soar
Wendy's is currently forming an ascending triangle pattern, a price setup that's formed by a horizontal resistance level above shares at $9.25 and uptrending support to the downside. Basically, as shares bounce between those two technically important price levels, they're getting squeezed closer and closer to a breakout above $9.25. When that happens, we've got our buy signal.
Momentum, measured by 14-day RSI, adds some extra confidence to upside in WEN; the momentum gauge broke its intermediate-term downtrend and switched into bull mode at the beginning of 2014. If and when $9.25 gets taken out, I'd recommend putting a protective stop just below the 50-day moving average.
United Microelectronics
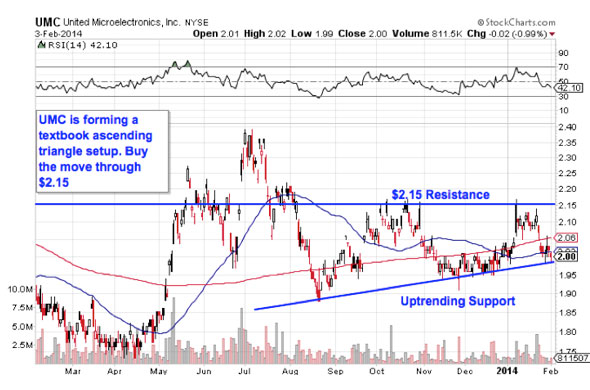
We're seeing the exact same setup in shares of Taiwanese semiconductor manufacturer United Microelectronics (UMC). Like Wendy's, UMC is forming an ascending triangle, in this case with resistance coming into play at $2.15. A push through that $2.15 price level is our signal to click "buy."
>>3 Stocks Rising on Unusual Volume
When you're looking at any technical price pattern, it's critical to think in terms of those buyers and sellers. Triangles and other pattern names are a good quick way to explain what's going on in a stock, but they're not the reason it's tradable. Instead, it all comes down to supply and demand for shares.
That $2.15 resistance level is a price at which there has been an excess of supply of shares; in other words, it's a place where sellers have been more eager to step in and take gains than buyers have been to buy. That's what makes a breakout above it so significant -- the move means that buyers are finally strong enough to absorb all of the excess supply above that price level. Wait for the breakout before taking the trade.
Rite Aid
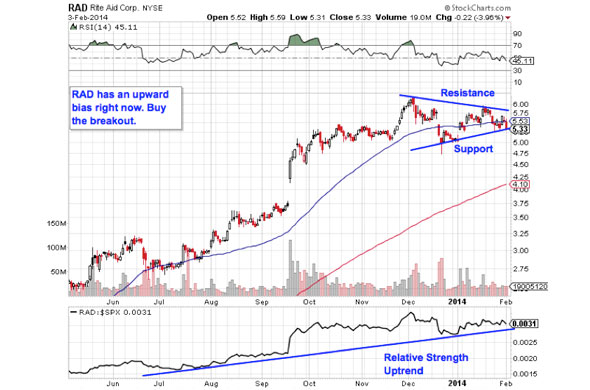
A triangle of a different sort is shaping up in shares of Rite Aid (RAD). Shares of the mid-cap drugstore chain are coming off the heels of a jaw-dropping 213% year, but the symmetrical triangle on the chart indicates that more upside could be on the way.
>>4 Big Stocks on Traders' Radars
Rite Aid's symmetrical triangle is a setup formed by a pair of resistance and support trendlines that are converging at approximately the same rate. As with the ascending triangle, the buy signal comes on a push through resistance. While shares could still go either way from here, consolidation patterns like the symmetrical triangle are statistically more prone to resolve in the direction of the previous trend. Since Rite Aid's trend was definitely up, it's pointing higher from here.
Even better, Rite Aid is exhibiting some outstanding relative strength right now, an indication that shares are outperforming the broad market as we head into 2014. With the S&P 500 still very much in correction mode, relative strength is still the most important indicator in your technical toolbox. Wait for RAD to push above resistance before you buy.
Banco Santander
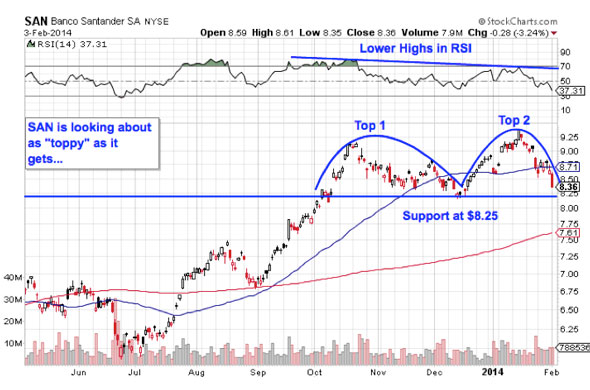
Banco Santander (SAN) is proof that a low share price doesn't necessarily mean a small company; this $94 billion financial firm tips the scales as one of the biggest banks on Earth. But its low price guarantees active trading in 2014 -- and that's not necessarily a good thing if you own this stock.
>>5 Rocket Stocks to Buy in February
The pattern to watch in Santander is a "double top." Like the name suggests, the setup is formed by two swing highs that lose steam at approximately the same level. The sell signal comes on a move through support at $8.25, a price that's getting tested this week. If SAN can't catch a bid at $8.25, it's time to sell (or go short).
Lower highs in RSI, our momentum gauge from the Wendy's chart, add some bearish bias to shares of Santander. That's an indication that downside moves are more aggressive and more frequent than up-days are right now. Being reactionary makes a lot of sense for the Santander trade. Wait to see how shares react to $8.25, then make your move.
BlackBerry
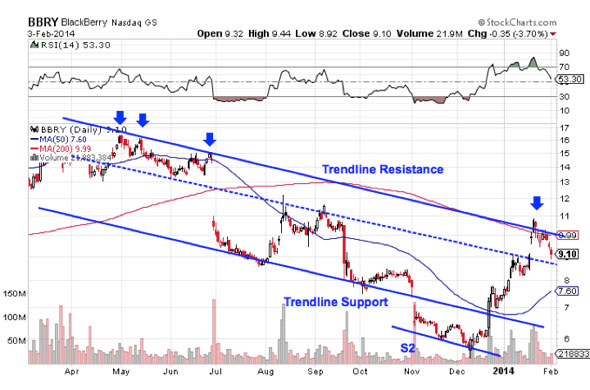
You don't have to be an expert technical analyst to figure out what's going on in shares of BlackBerry (BBRY) -- this mid-cap handset maker has one ugly chart right now. Frankly, BBRY is showing traders a trading setup that's about as simple as they get.
>>3 Huge Stocks to Trade (or Not)
Right now, BlackBerry is forming a downtrending channel, a bearish price setup that's formed by a pair of parallel support and resistance levels that BBRY has been bouncing between all the way up. When it comes to price channels, up is good and down is bad -- it's really as simple as that. Now this latest bounce lower in BBRY is providing an optimal opportunity to sell.
Waiting for that bounce makes sense for two major reasons: First, it's a price level that gives short sellers the most room to let the trade run before hitting support (or gets you out as high as possible), and second, all trend lines eventually break. Waiting for a bounce confirms that BBRY still can't catch a bid before you unload shares. I'd recommend staying far away as this mobile phone maker starts working its way back down the channel.
To see this week's trades in action, check out the Technical Setups for the Week portfolio on Stockpickr.
-- Written by Jonas Elmerraji in Baltimore.
RELATED LINKS:
>>3 Big-Volume Stocks to Trade for Breakouts
>>5 Big Trades to Profit During the Fed's QE Pay Cut
>>5 Short-Squeeze Stocks That Could Pop in February
Follow Stockpickr on Twitter and become a fan on Facebook.
At the time of publication, author had no positions in stocks mentioned.
Jonas Elmerraji, CMT, is a senior market analyst at Agora Financial in Baltimore and a contributor to
TheStreet. Before that, he managed a portfolio of stocks for an investment advisory returned 15% in 2008. He has been featured in Forbes , Investor's Business Daily, and on CNBC.com. Jonas holds a degree in financial economics from UMBC and the Chartered Market Technician designation.Follow Jonas on Twitter @JonasElmerraji
No comments:
Post a Comment