Gold has lost $200 over the past week. Oil is down 10% this month. Copper is almost 18% below its February high. And wheat and other agriculture commodities have dropped 20% since November.
Natural gas, however, has bucked the trend...
But by the look of the following chart, natural gas may be ready to join the busted commodity party. Take a look...
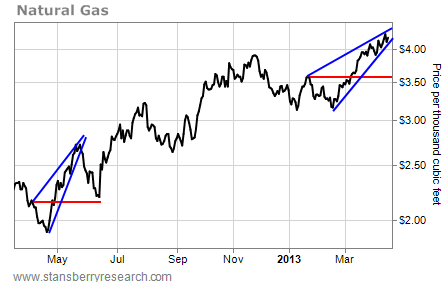
Natural gas is tracing out a rising-wedge pattern – where the distances between the highs and the lows grow closer together. Most of the time, charts break this pattern to the downside. And the resulting decline usually takes back 50%-100% of the height of the wedge.
We saw a similar pattern around this time last year... Back then, natural gas broke the rising-wedge pattern to the downside. The price fell 20%, and the decline erased about 60% of the height of the wedge.
If something similar happens today, shorting natural gas may work out to be a lucrative trade.
Traders could short natural gas around $4.30 and look to cover that short for a small loss if the chart breaks the wedge to the upside.
Aggressive traders can use the ProShares Ultra Natural Gas Fund (NYSE: BOIL) to trade the trends in natural gas prices. Please note... BOIL is a leveraged fund. So it's volatile and not for the faint of heart. Daily moves of 5% or more are common.
Best regards and good trading,
No comments:
Post a Comment