Results from David Fish's Dividend Champions Index compiled as of July 30, 2013 projecting price upside results one year hence showed HCP, Inc. (HCP), the healthcare properties real estate investment trust, posted a 9.45% upside to lead a pack of just four dogs this month.
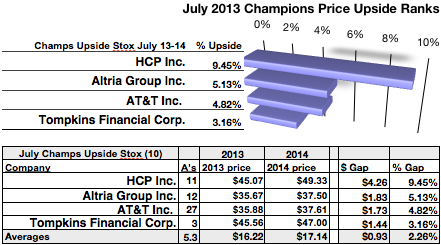
The chart above used one year mean target price set by brokerage analysts multiplied by the number of shares in a $1k investment to compare four Champions Index stocks showing the highest upside price potential into 2014 out of 20 selected by yield. The number of analysts providing price estimates was noted after the name for each stock. Three to nine analysts were considered optimal for a valid mean target price estimate.
This article reported results for the Champions Index as one of fourteen in a series of index-specific articles devoted to dividend yield and price upside results. Prompted by Seeking Alpha reader requests, the series has supplied results for these stock indices: Dow 30; Barron's 15 Gems; Russell 2000; S&P 500; S&P Aristocrats; Russell 1000; NASDAQ 100; NYSE International 100; Mergent Dividend Achievers; Champions; Contenders; Challengers; Carnevale's Power 25; Carnevale's Super 29.
This report presumed yield (dividend / price) dividend dog methodology applied to any index and compared that index side by side with the Dow. Below, are the Arnold Dividend Champions Index top dog selections for July were disclosed step by step.
Dog Metrics Graded Dividend Champions Index Stocks by Yield
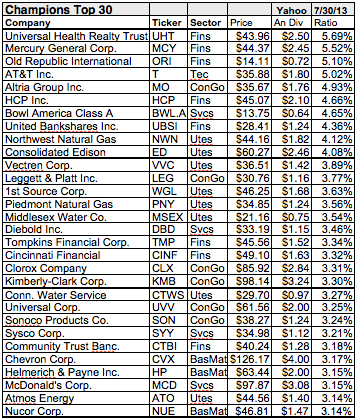
David Fish's June 28 Champions list of companies paying increasing dividends for 25 consecutive years or more was sorted by yield as of July 30 to reveal the top ten. Price and dividend data was sourced from Yahoo.com! .
Ten Champion dogs that promised the biggest dividend yields into July included firms representing five of nine market sectors. The top stocks were three of five from the financial sector: Universal Health Realty Trust (UHT); Mercury General Corp. (MCY); Old Republic Int'l (ORI). The other two financial firms, HCP Inc., and United Bankshares Inc. (UBSI), placed sixth and eighth.
The balance of the top ten included one technology firm, AT&T Inc. (T) in fourth place; one consumer goods, Altria Group Inc. (MO), placed fifth; Bowl America Class A (BWL.A) in seventh place was the lone service dog. Two utilities, Northwest Natural Gas (NWN), and Consolidated Edison (ED), in ninth and tenth places completed the representation of market sectors in the champions index.
Dividend vs. Price Results Compared to Dow Dogs
Below is a graph of the relative strengths of the top ten Dividend Champion dogs by yield as of market close 7/30/2013 compared to those of the Dow. Historic projected annual dividend history from $1000 invested in each of the ten highest yielding stocks and the total single share prices of those ten stocks created the data points shown in green for price and blue for dividend.
(click to enlarge)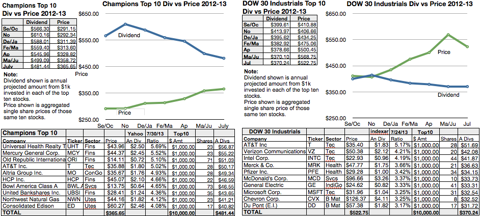
Actionable Conclusion One: Champion Dogs Ran With Bulls And Dow Didn't
The Champions top July dividend payers continued a bullish price course set since November, 2012. In the past month Champions top ten dog dividend dropped 3.5% while price rose nearly 2%.
For the Dow dogs, meanwhile, annual dividend from $1k invested in each of the top ten increased just 0.03% since June, while aggregate single share price dropped over 8%. Dow dogs decreased their overbought condition in which aggregate single share price of the ten exceeded projected annual dividend from $1k invested in each of the ten by over $198 or 53% in June was shrunk ! to $152.5! 1 or 41% in July.
Since Champion dogs may not all be the blue chip high quality equivalents of the Dow list and also include utilities, an additional gauge of upside potential was added to the simple high yield metric used to find bargains.
Actionable Conclusion Two: Wall Street Wizard Wisdom Went Wrong Wresting Just 4.89% Net Gain from Top 20 Dividend Champions Index Dogs In 2014
Top twenty dogs from David Fish's Dividend Champions index were graphed below to show relative strengths by dividend and price as of July 30, 2013 and those projected by analyst mean price target estimates to the same date in 2014.
A hypothetical $1000 investment in each equity was divided by the current share price to find the number of shares purchased. The shares number was then multiplied by projected annual per share dividend amounts to find the dividend return. Thereafter the analyst mean target price was used to gauge the stock price upsides and net gains including dividends less broker fees as of 2014.
Historic prices and actual dividends paid from $1000 invested in the ten highest yielding stocks and the aggregate single share prices of those twenty stocks divided by 2 created data points for 2013. Projections based on estimated increases in dividend amounts from $1000 invested in the twenty highest yielding stocks and aggregate one year analyst target share prices from Yahoo Finance divided by 2 created the 2014 data points green for price and blue for dividends.
(click to enlarge)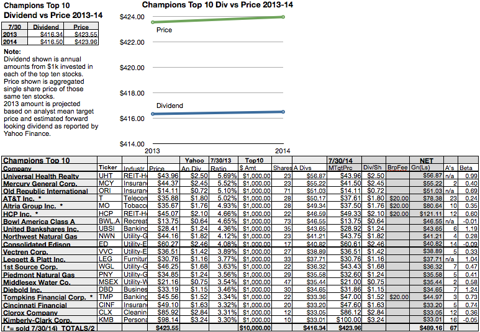
Yahoo projected a 0.03% higher dividend from $10K invested in this group while aggregate single share price was projected to increase over 0.09% in the coming year. The number of analysts contributing to the mean target price estimate for each stock was noted in the next to the last column on the charts. Three to nine analysts was considered optimal for a valid estimate! .
T! he Champions was the first index to exhibit a topped out condition. In April the top twenty stock analyst aggregate one year mean target price sank while dividend increased. In July future price increased while future dividend also increased as most of the stocks on the roster were listed with current prices higher than analyst one year target estimates.
A beta (risk) ranking for each analyst rated stock was provided in the far right column on the above chart. A beta of 1 meant the stock's price would move with the market. Less than 1 showed lower than market movement. Higher than 1 showed greater than market movement. A negative beta number indicated the degree of a stocks movement opposite of market direction.
Actionable Conclusion Three: Analysts Forecast 4 Dividend Champion Dogs to Net 3% to 9% By June 2014
Just four probable profit generating trades were revealed by Yahoo Finance for 2014:
(click to enlarge)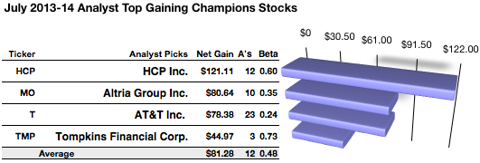
HCP Inc. netted $121.22 based on dividends plus mean target price estimate from twelve analysts less broker fees. The Beta number showed this estimate subject to volatility 40% less than the market as a whole.
Altria Group Inc. netted $80.64 based on a mean target price estimate from ten analysts combined with projected annual dividend less broker fees. The Beta number showed this estimate subject to volatility 65% less than the market as a whole.
AT&T Inc. netted $78.38 based on dividends plus the mean of annual price estimates from twenty-three analysts less broker fees. The Beta number showed this estimate subject to volatility 76% less than the market as a whole.
Tompkins Financial Corp. (TMP) netted $44.97 based on a mean target price estimate from three analysts combined with projected annual dividend less broker fees. The Beta number showed this estimate subject to volatility 27% less than the market as a wh! ole.
The average net gain in dividend and price was over 8.1% on $1k invested in each of these four dogs. This gain estimate was subject to average volatility 52% less than the market as a whole.The stocks listed above were suggested only as decent starting points for your index dog dividend stock purchase research process. These were not recommendations.
Disclaimer: This article is for informational and educational purposes only and should not be construed to constitute investment advice. Nothing contained herein shall constitute a solicitation, recommendation or endorsement to buy or sell any security. Prices and returns on equities in this article except as noted are listed without consideration of fees, commissions, taxes, penalties, or interest payable due to purchasing, holding, or selling same.
Disclosure: I am long DD, GE, INTC, MCD, MSFT, PFE, T, VZ. I wrote this article myself, and it expresses my own opinions. I am not receiving compensation for it (other than from Seeking Alpha). I have no business relationship with any company whose stock is mentioned in this article. (More...)
No comments:
Post a Comment