BALTIMORE (Stockpickr) -- It's hard to believe, but the year is quickly drawing to a close. Monday kicks off the first trading session in December.
What a year it's been: Year-to-date, shares of the S&P 500 are up a staggering 26.4%, catching bears (and even some bulls) by surprise since the first trading session in January. But it's a little early to start wrapping up the books for 2013. After all, December is typically no-slouch when it comes to performance numbers.
Since 1926, buying stocks in the final month of the year has been a pretty good strategy. Even during the market crash of 2008, December brought a reprieve from the selloff, shedding just 2.62% from the S&P's value. Even with a tailwind for the big indexes, selectivity still matters. By focusing on high-probability trades (and skirting underperformers), you can wring out the biggest returns in the final stretch of 2013.
That's why we're taking a technical look at five big-name trades to take this week.
If you're new to technical analysis, here's the executive summary.
Technicals are a study of the market itself. Since the market is ultimately the only mechanism that determines a stock's price, technical analysis is a valuable tool even in the roughest of trading conditions. Technical charts are used every day by proprietary trading floors, Wall Street's biggest financial firms, and individual investors to get an edge on the market. And research shows that skilled technical traders can bank gains as much as 90% of the time.
Every week, I take an in-depth look at big names that are telling important technical stories. Here's this week's look at five high-volume stocks to trade this week.
Stericycle
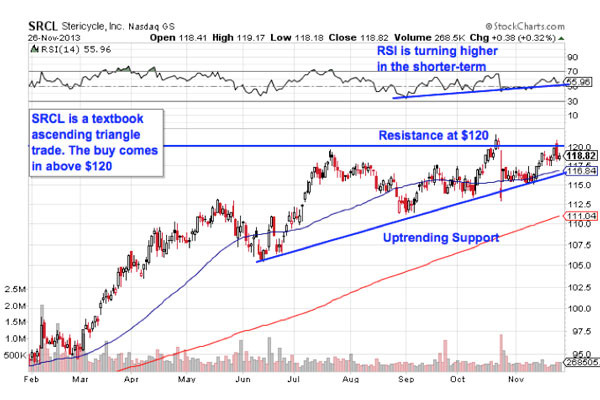
First up is $10 billion medial waste disposal company Stericycle (SRCL). While SRCL has more or less only kept pace with the broad market in 2013, shares are at the point where they're looking primed to pop into December trading. Here's why.
Stericycle is currently forming an ascending triangle setup, a bullish price pattern that's formed by a horizontal resistance level above shares at $120 and uptrending support to the downside. Basically, as SRCL bounces in between those two technically-important price levels, it's getting squeezed closer and closer to a breakout above the $120 level. When that breakout happens, we've got a buy signal.
Whenever you're looking at any technical price pattern, it's critical to think in terms of those buyers and sellers. Triangles and other pattern names are a good quick way to explain what's going on in a stock, but they're not the reason it's tradable – instead, it all comes down to supply and demand for shares.
That $57 resistance level is a price where there has been an excess of supply of shares; in other words, it's a place where sellers have been more eager to step in and take gains than buyers have been to buy. That's what makes a breakout above it so significant -- the move means that buyers are finally strong enough to absorb all of the excess supply above that price level.
Since HSBC is a longer-term pattern, the 200-day moving average is the spot to keep a stop loss after buying. It's been a pretty good proxy for support on the way up.
Apple
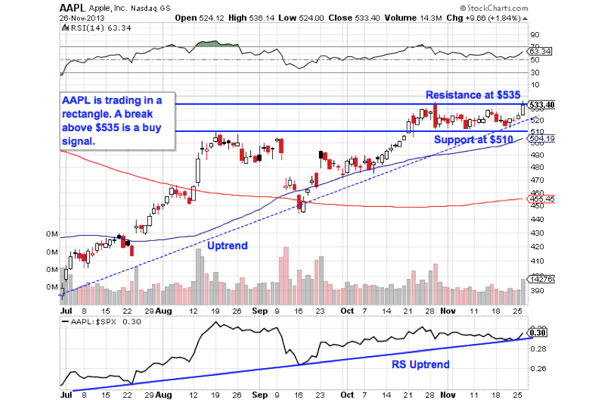
Despite a shaky start to 2013, Apple (AAPL) has been on a tear since the summer. I've been a fan of the stock for a while now too -- and I've still have a position in AAPL shares. After spending November in sideways-mode, AAPL looks ready to move higher again.
After moving up close to 20% off of September's swing low, Apple has been consolidating sideways in a rectangle pattern. The rectangle is a price setup that's formed by a horizontal resistance level above shares at $535, and another horizontal support level down at $510. The rectangle gets its name because it essentially "boxes in" shares. The high-probability trade comes when Apple exits its channel – a move through $535 is a buy signal.
Apple's relative strength, a measure of this stock's performance versus the broad market, has been on fire for the last six months. From a statistical standpoint, an uptrend in RS is a very good indication that shares will continue to do well in the medium-term.
I'm holding on from here.
Anadarko Petroleum
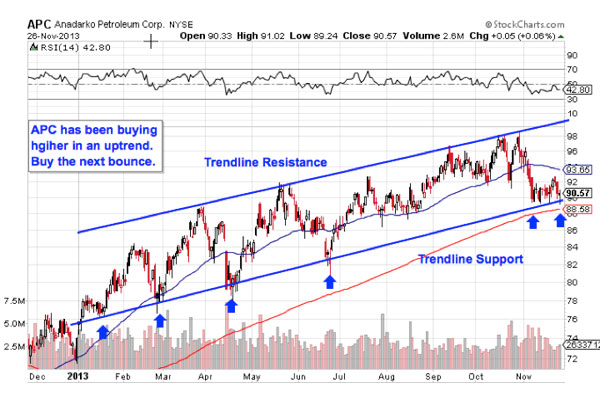
Meanwhile, things are looking a little simpler in shares of Anadarko Petroleum (APC). You don't have to be an expert technical analyst to figure out what's going on in shares of the $45 billion E&P firm -- a quick glance at the chart should do.
Anadarko is currently forming an uptrending channel, a price setup that's about as basic as a technical pattern gets: up is good, down is bad. The channel provides traders with a high-probability range for shares to stay within -- and now, with APC testing trendline support, traders are coming up on a big buying opportunity in this stock. After all, buying the last five bounces off of trendline support has been a good strategy this year.
Buying off a support bounce makes sense for two big reasons: It's the spot where shares have the furthest to move up before they hit resistance, and it's the spot where the risk is the least (because shares have the least room to move lower before you know you're wrong). Remember, all trend lines do eventually break, but by actually waiting for the bounce to happen first, we're ensuring Anadarko can actually still catch a bid along that line.
Keep a close eye on this name -- we could get the bounce in today's session.
General Electric
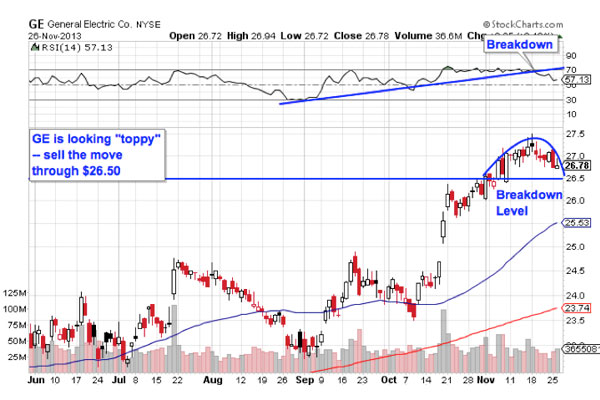
Not all of the setups we're looking at today are bullish. Right now General Electric (GE) is looking anemic in the short term. GE is currently forming a rounding top, a pattern that looks just like it sounds. The rounding top indicates a shift in control of shares from buyers to sellers, and it triggers a sell (or short) signal on a move through the $26.50 breakdown level.
The setup in GE is relatively small, and that means that the trading implications to the downside are relatively contained too -- but that also means that GE is likely to be a serial underperformer during December, a month when it makes sense to take advantage of better relative strength.
The uptrend break in RSI on the upper chart just adds some fuel to the fire for GE. Shares had been overbought coming into the rounding top pattern, and if shares can't catch a bid any longer at $26.50, expect a pretty quick move lower.
To see this week's trades in action, check out this week's Must-See Charts portfolio on Stockpickr.
-- Written by Jonas Elmerraji in Baltimore.
No comments:
Post a Comment